Bringing hematology testing to the point of care - the history of Boule Diagnostics
The history of hematology
Hematology is the medical discipline that covers studies and treatment of blood disorders. The science dates back as far as to the ancient Egypt and the practice of bloodletting. In the 1670’s, the field gained a breakthrough with the development of the high-magnification microscope by Antonie van Leeuwenhoek (Fig 1). Today, a CBC test is frequently requested by physicians to evaluate a patient’s blood status.
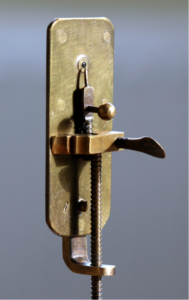

Fig 1. (A) The single-lens microscope developed by (B) the Dutch businessman and scientist Antonie van Leeuwenhoek in the 1670’s (images A and B are licensed under CC BY-SA 3.0 and CC BY 4.0, respectively).
Traditionally, a laboratory technician uses a microscope to manually count the red blood cells (RBC), platelets (PLT), and the white blood cells (WBC) (Fig 2). As part of the CBC, a WBC differential count is often conducted, in which about 100 WBCs are differentiated into the five major subpopulations, the neutrophils (NEU), lymphocytes (LYM), monocytes (MON), eosinophils (EOS), and basophils (BAS) (Fig 3). Each cell type is reported as a percentage of the total WBC count, and a shift in the percentage outside of the normal reference interval is an indication of an abnormal health condition.
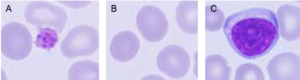
Fig 2. A complete blood count is used to measure (A) the platelets that help the blood clot; (B) the red blood cells containing the oxygen-carrying hemoglobin; and (C) the white blood cells of the immune system.
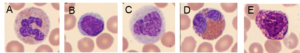
Fig 3. In a WBC differential count, the white blood cells are differentiated into their five major subgroups: (A) neutrophils, (B) lymphocytes, (C) monocytes, (D) eosinophils, and (E) basophils.
Today, this type of analysis is conducted using an automated cell counter. However, abnormal or atypical cell variants can be difficult for a hematology analyzer to distinguish from normal cell populations. Blood smear analysis therefore remains an important diagnostic tool to determine immature or abnormal cells (Fig 4). Typically, you let the analyzer do the actual cell count, which is then confirmed under the microscope at the same time as the presence of immature or abnormal cells is investigated.
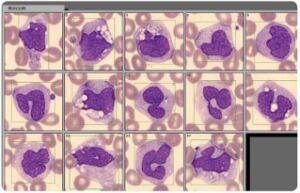
Fig 4. A blood smear analysis is often used to follow-up sample results flagged as abnormal in the CBC analysis on the automated hematology analyzer.
Automating the cell count process
Automated cell counters were developed as early as in the 1950s. The first European cell counter was developed by Erik Öhlin in 1956. This analyzer—manufactured by Lars Ljungberg & Co and marketed under the Celloscope trademark—was first displayed at a German tradeshow in September 1957 (1). The Celloscope analyzer was based on a similar principle as the one patented and implemented in the prototype Coulter Counter™ Model A in 1953 by Wallace H. Coulter (U.S. Patent 2,656,508). However, based on simpler electronics and equipped with an integrated sample stand, the Celloscope analyzer was both smaller and less costly that the Coulter Counter Model A analyzer (Fig 5.
A) B)
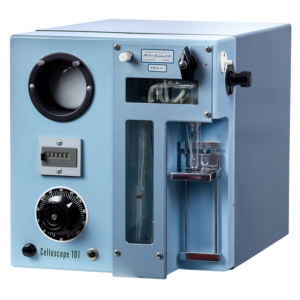
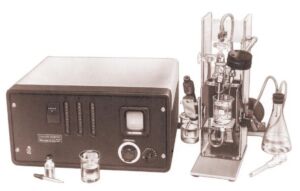
Fig 5. The (A) Celloscope 101 counter and the (B) Coulter Counter Model A (image attributed Coulter Corporation and licensed under the CC BY-SA 3.0 license) pioneered the hematology analyzer market in the 1950s.
The launch of the very first cell counters meant a great milestone for hematologists, which otherwise were referred to the cumbersome work of manually counting cells under the microscope. In an article by Tor-Arne Hagve (2), Lars Ljungberg describes the history of the Celloscope instrument:
“We had been thinking for a long time about different ideas for counting blood cells, when we heard that The American Navy had presented a solution where, for example, red blood cells were sucked through a capillary hole, through which a weak direct current passed simultaneously. Blood cells are non-conductive and therefore modulate the current. These ‘interruptions’ are calculated on a simple mechanical counter. We diluted the blood in a physiological saline solution, and both erythrocytes and leukocytes were counted at the same time, as the number of leukocytes did not affect the erythrocyte result more than about 1/100,00,00.
For the leukocyte count, we hemolyzed the cells with saponin in the same sample as we counted all the blood cells. What we had left to count were then the nuclei of the leukocytes. To count platelets, we switched to a smaller capillary hole.
We started selling the Celloscope analyzer in the early 60’s. What we did not know then was that a certain Mr. H.W. Coulter in Chicago had applied for and obtained a patent for the principle that I have described. Many and long negotiations followed, which were ‘tough’ and did not lack their points. Coulter had patents in the United States and in some European countries, such as France, Germany, and England. We were free to sell, for example, in Sweden, Norway, Denmark, Finland, most other countries in Europe, the former Soviet Union, most of Asia and India, and not to forget, in Africa. We eventually reached an agreement with Coulter, where we compensated him for the sales we happened to make in “his countries”. I honestly do not know if Coulter is the inventor, but he was the patent holder.”
Introducing Swelab analyzers
Erik Öhlin later founded Swelab Instrument AB in 1969 (Fig 6), and by the acquisition by Boule Diagnostics in 1997, a subsidiary was formed and the name was changed to Boule Medical.
Eva Johannesson (currently Senior Project Manager QA/RA, Boule Medical, Sweden) started with Swelab Instruments in 1996: “China was by far the largest market. There were also some sales in Sweden. As 5-part instruments were rather expensive, and hence, not very common, 3-part instruments were also of interest for larger hospital laboratories back then.”
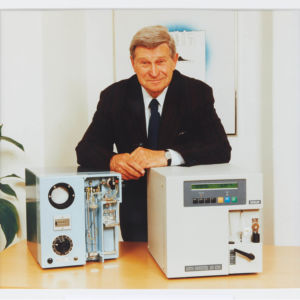
Fig 6. Erik Öhlin, with the Celloscope counter (left) and Swelab™ AutoCounter (right).
Technical advancements in hematology testing
Dr Anders Kallner, former senior consultant and Associate Professor at Karolinska University Hospital, came to its chemistry and hematology laboratory in 1971 (4): “When I came to the Karolinska Hospital, all activities in the laboratory were manual, from reagent preparation to reporting of results. Hematology was cell counting based on microscopy and hemoglobin measurements in simple photometers.”
Automation of measurements in laboratories accelerated with the introduction of the AutoAnalyzer SMA-4, invented by Leonard Skeggs in the late 50s and commercialized by Technicon (now part of Siemens) in the 60s. The system was originally designed for serum components but finally developed to determine four parameters: HGB, HCT, RBC, and WBC (2, 3). The impedance method, as realized in the Celloscope and Coulter Counter instruments, could be further developed to take automated hematology to another level by measuring hemoglobin and identification and counting of three types of leucocytes: granulocytes (GRA), monocytes (MON) and lymphocytes (LYM). As computer technology gradually developed and became miniaturized, the instruments became correspondingly competent. Eventually, in the 80s, analyzers capable of differentiating the WBC population into five sub-groups (NEU, LYM, MON, EOS, BAS) became available. These systems were initially intended for hospital laboratories and required a skilled staff and a high sample load to justify their relatively high cost.
However, with the increasing need for modern and decentralized healthcare, the demand for simple and reliable instruments and procedures emerged also in hematology and prompted the development of benchtop instruments that could be used in a near-patient clinical setting with a minimum of training.
Introducing Medonic analyzers
Medonic AB was founded in 1982 by Ingemar Berndtsson and Bram Bottema, both with a long history and experience in hematology, clinical chemistry, and blood-banking engineering. Ingemar and Bram worked with cell counters at Analysinstrument AB, when they concluded that they could develop a cell counter of their own. In 1982, they founded Medonic AB.
Tommy Andersson (currently Senior Systems Engineer at Boule Medical, Sweden) was assigned to the project for development of the very first Medonic analyzer: “The cell counters of that time used LED screens for reviewing of results. In 1985, Medonic launched its first own-developed cell counter, Cellanalyzer CA 480, with a built-in display that also showed the histograms.”
The Medonic Cellanalyzer CA 480 reported the basic PLT, RBC, WBC, HGB, HCT parameters as well as the mean red cell volume (MCV), an important parameter in anemia investigations. With a compact benchtop design, the analyzer was well-suited for the smaller laboratory (Fig 7).
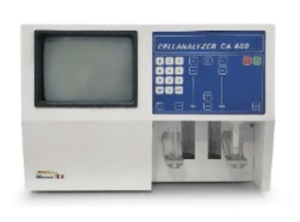
Fig 7. Medonic™ Cellanalyzer CA 480.
In contrary to other instrument manufacturers that were targeting the larger hospital laboratories, Medonic AB was targeting the smaller laboratories. Typically, the smaller laboratories were referred to manual count under the microscope or to sending samples for central testing at a larger hospital laboratory. Although the larger laboratories had higher sample throughput, Medonic saw a business opportunity with the smaller laboratories, as they were more in number.
When personal computers began to be incorporated into the hematology systems, also other brands, like the Swelab analyzers, came with a display.
Swelab Instrument AB was a competitor of Medonic at that time, targeting the same customer segment. When acquired by Boule Diagnostics in 1998, however, the Medonic team was working side by side with the Swelab team in facilities in Västberga, Stockholm, Sweden.
Key process steps in focus for performance enhancements
In the first-generation analyzers, a fixed volume of sample was aspirated using a peristaltic pump. The aspiration process was time-dependent, that is, the pump was calibrated to aspirate sample during a fixed
time into a mixing cup, where the sample was diluted. The diluted sample was thereafter allowed to pass through an aperture under a pressure gradient at a fixed time, during which the sample flow (volume/time unit) and number of pulses (corresponding to the cell number) were
recorded. The software analyzed the size of each pulse and ascribed the corresponding cell to a discriminator-defined cell population.
The major technology advancements of automated hematology analyzers relate to three steps of the cell count process:
- Sample aspiration technique.
- Cell count method (sample dilution and cell count principle).
- Cell discrimination method.
Sample aspiration technique
Although simple and economic to build, the first-generation analyzers had their technical limitations. The precision and accuracy were poor, making the reliable use of these systems in monitoring the efficacy of medicine difficult. Time-based aspiration by using a peristaltic pump suffers from frequent system calibration, as the aspirated volume starts deviating from the “ideal volume” with the decreasing efficiency of the pump, resulting in high variation (CV) in the results.
Such an aspiration method also requires that the aspiration module moves to the mixing cup through an X-Y moving assembly, which might increase the frequency of maintenance. The open mixing cup that is required for the free-moving aspiration assembly is also susceptible to accumulation of dust and other impurities. In later years, most manufacturers have replaced the peristaltic pump with a micro-syringe that reduces the frequency of calibration to some extent, however, frequency of maintenance remains the same.
Cell count method
The basic principle of the time-based aspiration method is that the aspirated blood sample is diluted and thereafter flushed to the measuring chamber. A pressure difference between the two sides of the aperture is built up, after which the number of pulses caused by cells flowing through the aperture, is counted as a function of time (Fig 8).
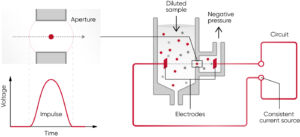
Fig 8. The principle for measuring changes in the electrical impedance produced by a cell passing through an aperture. Each cell passing through the aperture gives rise to a pulse. The number of generated pulses correlates with the number of cells, whereas the size of the pulse is related to the cell size.
After a certain time, the process is interrupted and the cell concentration (c) in the diluted sample is calculated (Fig 9). As the measurement is a function of time, the method suffers from high probability of inaccuracy if there is a small change in the pressure difference over the aperture or if protein or any other impurities build up within the aperture and partially block (thereby reduce) the flow, and as consequence, decreases the recorded concentration (c). Some manufacturers claim that their analyzers count the cells twice or even three times to increase accuracy. However, if the aperture is clogged, the accuracy and precision will not necessarily improve by counting the cells more times. Instead, the re-calibration need might increase.
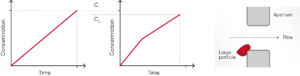
Fig 9. Compared with (A) the cell concentration 1 (c1), the (B) cell concentration 2 (c2) can be falsely low in case of (C) build-up of particles that clog the aperture, resulting in inaccurate measurement results.
The second-generation analyzers, pioneered by Sysmex, offered unique solutions to both the aspiration technique, using a sample rotary valve (shear valve), and cell count method, calculating the cell concentration based on a fixed volume of diluted sample and the number of generated pulses in that specific volume. This method is known as the “absolute volume measurement principle”.
In these second-generation analyzers, the aspirated volume is greater than in the first-generation analyzers, using a time-based method for the cell count. Rather than time-dependency, the aspiration is stopped by a blood sensor and a precise volume is cut and brought to a closed mixing chamber using diluent reagent. This way, no mechanical movement of the aspiration module is required, minimizing the maintenance needs. As the shear valve cuts the same precise volume for each measurement, the analyzer calibration stays stable for a longer period of time.
For the cell count, the diluted sample pushes the liquid (diluent) in a metering unit, consisting of a glass tube and two optical sensors. When the diluent flows through the tube, it first triggers the start-sensor and then the stop-sensor and the cell count is registered during these two trigger events. The volume between the start- and stop-sensors is equal to the measured volume of the diluted sample used for the cell count (Fig 10).
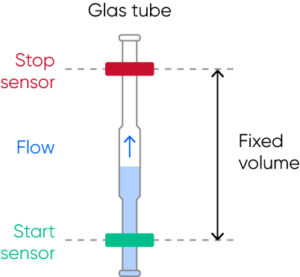
Fig 10. The metering unit, consisting of a glass tube and two optical sensors, ensures precise and accurate cell count results each time.
The interval of reaching from the start-sensor to the stop-sensor might vary (within a stipulated time range) due to a partial clog of the aperture, however, the cell count will continue until the diluent reaches the stop-sensor and a constant volume is thus always recorded, ensuring precise and accurate results.
As the test results from a second-generation analyzer are independent of external pressure or temperature or even partial clog at the aperture or dust particles in the mixing chamber, the variation in measured parameters is also significantly lower than for first-generation analyzers. The risk of dust particles affecting the results is especially critical for the smallest corpuscles, namely the platelets.
Although the complex nature of the hardware increased the instrument cost, these second-generation analyzers were a better choice for medical decision-making that the first-generation instruments.
Overcoming the limitation of second-generation analyzers
Still, there were areas where the second-generation instruments failed:
- Microcytic RBCs counted as PLTs:
- Accurate and precise PLT count is extremely important for diagnosis and monitoring of patients suffering from diseases like dengue fever, Leptospirosis, and malaria infection. The PLT count is also an important tool to determine whether a patient is ready to be administered a chemotherapy dose. A falsely elevated PLT count is therefore a challenge for individuals with high numbers of microcytic RBC populations.
- NEU falsely counted as LYM:
- Strong hemolytic effect of the lyse reagent used in first- and second-generation analyzers resulted in false lymphocytosis, for example, during early sepsis conditions where the NEU cells lose their cellular structure and thus were counted as LYM cells.
- High maintenance needs:
- For instruments using an open sheer valve, salt crystals and blood remnants that get in contact with air can deposit at the junction of the two discs of the shear valve, requiring excessive manual cleaning. If not done in a timely manner, the crystals enhance the wear and tear of this expensive part.
- Although partial clogging does not impact the accuracy of results in second-generation instrument, it is good for the operator to know the cleanliness of the aperture during operations. Consequently, the second-generation analyzers were set with a mandatory auto de-clogging process on a regular basis, which enhanced the wear and tear of the costly aperture.
By the introduction of the Medonic and Swelab analyzers, as part of the third-generation cell counters, Boule Medical provided solutions to all these challenges:
- Floating discriminator technique ensures accurate separation of the RBC and PLT populations (see Section Cell discrimination method).
- The mild lyse reagent helps create a WBC size gradient, while maintaining cell structure even of pathogenic NEUs to prevent them from being over-hemolyzed, thereby minimizing the risk of them interfering with the LYM count.
- Closed shear valve design prevents entry of environmental impurities that might cause contamination and leakage. Additionally, the shear valve is flushed with diluent reagent to prevent build-up of salt deposits that might also cause leakage. To avoid wear and tear of the shearing discs, the shear valve is soaked in diluent, ultimately mitigating the need for replacement.
- To reduce risk for clogging, high-voltage burning of the aperture (cleaning based on generated air bubbles) is automatically carried out, but only when needed to reduce wear and tear. The flow rate is monitored by the analyzer and if the flow is irregular, an error alarm is triggered to alert the operator to re-count the cells and a de-clogging is automatically performed by the analyzer (Fig 11).
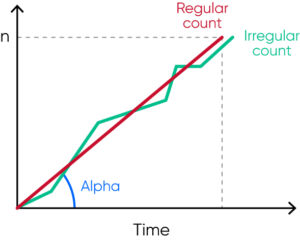
Fig 11. The analyzer regularly monitors the flow rate, and irregular flow triggers an SE (measurement statistics warning) flag that alerts the operator of that automatic de-clogging will be conducted by the analyzer.
Cell discrimination method
Many legacy cell counters use a fixed discriminator at 30 fL for separation of RBC and PLT populations. However, excessive number of PLTs might interfere with the mean red cell volume (MCV) parameter. Similarly, microcytic (small) RBCs with low MCV can give falsely elevated PLT counts, as the minima between PLT and RBC histograms cannot be identified due to the mix of microcytic RBCs and PLTs well before the cell size discriminator at 30 fL.
Such effects can be minimized with floating discriminator technique that estimates the best separation between cell populations. Medonic and Swelab 3-part analyzers use a discriminator that floats between 10 and 28 fL, thereby preventing the microcytic RBCs to be falsely counted as PLTs (Fig 12).
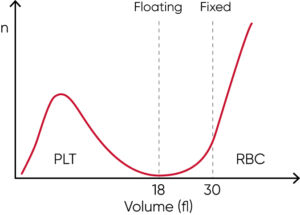
Fig 12. Floating discriminator technique prevents microcytic RBCs to be falsely counted as PLTs and elevated PLTs to interfere with the RBC count.
Building on the legacy
Boule Diagnostics acquired both Swelab Instrument AB and Medonic AB in the late 90s to create synergy effects in technical development, and keeping the parallel brands was a strategy to obtain a larger revenue. When acquired, both Swelab and Medonic instruments used reagents from JT Baker, the Netherlands.
At about the same time as Coulter was acquired by Beckman, Clinical Diagnostic Solutions, Inc. (CDS) was founded in 1997 by former Coulter collaborators Dr. Harold R Crews, with a background in R&D of consumables, Andrew C Swanson from the Service organization, and Donald Grantham from Marketing and Sales. The initial objective was to provide third-party services, but the focus was soon shifted to development and production of generic reagents and control material.
Mike Elliott (currently Senior VP of Business Development, CDS, USA) was recruited from Beckman Coulter in 2000: “It was the early OEM products that kept CDS afloat, and CDS worked together with instrument manufacturers in development of reagents for their systems. Ernst Westman, former CEO of Boule Diagnostics, met Andrew in 2003, and a consumables development projects for Boule’s early hematology analyzers was initiated. In 2004, CDS was acquired by Boule Diagnostics to further enhance the hematology business, and the year after, the reagent production was transferred from JT Baker and the control material production from R&D Systems to CDS.”
Soon, revenue was split evenly between CDS branded generic consumables and OEM consumables for Boule and other major players on the hematology market. Although focus was on 3-part hematology systems, CDS also developed and produced consumables for other types of systems such as flow cytometry analyzers. Over the years, however, by the introduction of barcode- and RFID-locked reagents, the generic consumables business has declined. While consumables are the core business of CDS today, a large part of the present staff has extensive experience from development and production of both instruments and consumables as part of a complete hematology system, from their background with Coulter as well as from the large number of OEM collaboration projects.
“When I took over as CEO in January 1994, we were 14 employees and had our own production and sales of microbiological tests as well as the sales of a number of distributed products for the Swedish market”, Ernst Westman explains. “In 1997, the Swedish instrument company Swelab Instrument AB was for sale. At the same time, I was notified about Medonic AB, which was another instrument company with similar products and focus. After reviewing both companies, we concluded that it would be best to acquire both Swelab and Medonic, which we did in 1998.”
A collaboration was initiated with CDS regarding the human market, which resulted in that Boule received FDA approval to launch Medonic for the human market in 2004 and CDS became the distributor.
The next challenge was to develop a new, improved, and consolidated instrument platform that could be the basis for both Medonic and Swelab products. The new product generation was completed in 2006. The development of a system for veterinary applications was also started to establish Boule in both the human and veterinary markets.
“Right from the start, we saw a serious challenge in that the profitability of instrument sales gradually decreased”, Ernst continues. “At the same time, we knew that the aftermarket, that is, the sale of consumables for the instruments, was very profitable. CDS, with which we already collaborated, had the expertise required to develop and produce this type of product, which is why the decision was made to acquire the company. “
By the acquisition of Swelab Instrument AB and Medonic AB, Boule Diagnostics sold the distribution business of its subsidiary Boule Nordic and the Swelab and Medonic instrument manufacturing was transferred to Boule Medical. As a second step, the bacterial analysis business, with which Boule Diagnostics was initiated, was also sold. The acquisition of CDS was completed by the end of 2004, meaning that Boule Diagnostics acquired the skills to master the development and production of both instruments and consumables. The possibility to pursue continuous improvements with a holistic view has resulted in high-quality systems with a quality advantage that have helped gain customer trust year after year.
Boule Total Quality Concept
An automated hematology system comprises both the analyzer as well as it dedicated consumables (Fig 13). At Boule Diagnostics, reagents are designed and developed in conjunction with the analyzer to provide optimized performance and enhanced serviceability of the complete system. Reagents and analyzer measurement technology, including the analysis algorithms, are fine tuned to each other to produce the most accurate patient results. Formulations, dilutions, mixing, and reaction kinetics are all carefully matched and optimized to work together.
One of the most important elements of a complete hematology system is the quality control (QC) material. Like the reagents, the control and calibrator cell populations are matched to the system measurement technologies and analysis algorithms.
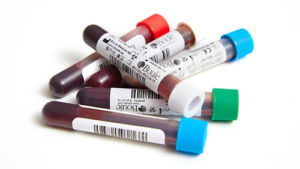
Fig 13. It is recommended to use of Boule controls every day as a routine QC procedure. Barcode screening facilitates input of assay values, while preventing potential errors.
To ensure analytical quality and performance, it is therefore recommended to only use consumables that are specifically designed for the intended analyzer. To facilitate proper use of Boule hematology systems, reagents are entered by simply scanning the RFID card on the reagent container (Fig 14). At the same time, the analyzer stores key reagent information such as lot number, open and expiry dates, and remaining volume, all for operator convenience, while providing the reagent traceability required by various accreditation bodies
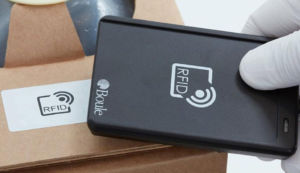
Fig 14. To ensure analytical quality and performance of the hematology system, it is recommended to only use the designated reagents that are entered by scanning the RFID card on the container.
Boule hematology in future perspectives
Today, Boule systems are used in general screening of patients’ health status and constitute valuable tools to aid in diagnosis and monitoring of health conditions such as infectious diseases and anemia (5,6). Boule Diagnostics operates through its headquarter in Sweden, Boule Medical AB, with subsidiaries in Mexico and in Russia, through CDS in the USA (Fig 15), and through sales offices in Brazil, China, India, and Malaysia.
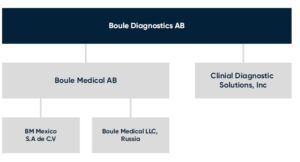
Fig 15. Boule Diagnostics 2021.
Boule analyzers are purpose-built for the smaller hospital and clinical laboratories, with a robust design and features such as the space-saving automation wheels and micro-pipette adapter inlet for capillary blood samples.
Sigward Söderström, former Biomedical Scientist at Örebro University Hospital (Fig 16), explains the benefit with Boule hematology solutions in decentralized laboratory testing:
“The great benefit of using Boule analyzers for blood cell counting in primary care is that the lead times from blood tests to diagnosis are significantly shortened. Being able to make a correct diagnosis as soon as possible and start the right treatment significantly increases the patient’s ability to recover from their illness. The possibility of being able to catch the patient already in primary care also contributes to significantly greater patient safety and quality of care.”

Fig 16. Sigward Söderström, former Biomedical Scientist at Örebro University Hospital, together with colleagues at the Department of Clinical Chemistry, Örebro University Hospital, Sweden, collected and reviewed all material used in Medonic M32 and Swelab Alfa Plus case books (5, 6).
The Boule product portfolio comprises solutions for both human and veterinary diagnostics. The product platform based on impedance technology has expanded to cover solutions also for veterinary diagnostics, complemented with a small chemistry analyzer, as well as extended to also include laser-based methods for the WBC differential (Fig 17).
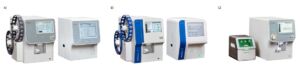
Fig 17. Boule product lines include (A) Swelab and (B) Medonic 3-part and 5-part hematology systems for human diagnostics, and (C) Exigo™ hematology and chemistry analyzers for animal diagnostics.
Based on a solid technology foundation, many innovative solutions are in the development pipeline. The mix of experienced senior and talented junior engineers ensures that ideas for meeting unmet customer needs are turned into creative product features also in the future.
Elin Andersson, with a MSc in Engineering Physics from the Medical Technology program at the Royal Institute of Technology, Stockholm, Sweden, has been with Boule since 2019. “My position as a Software Test Engineer at Boule is my first after graduation. My education has provided me with problem-solving skills and a technical knowledge that allows me to be quickly up at speed with development of different parts or subsystems. I have developed a lot since I first came to Boule, which to large part can be attributed to my colleagues that see a benefit in recruiting young and hungry engineers to the company. I have, for example, gained a deeper understanding of the regulatory part of the business through the possibility of being involved in different stages of product development. If you show drive and willingness to develop, my experience is that you get the opportunity to do so and that we younger engineers can also make us heard. I chose Boule as my workplace, as this is a smaller company that provides greater opportunity for involvement than a larger company might would. A benefit for me was also the fact that part of the development and production is in Sweden. As I am passionate about medical technologies, I had my eyes on Boule ever since I was first introduced to the company during my time at the Royal Institute of Technology.”
Anton Rundberg, also with a degree in Engineering Physics, however, in materials science with a specialization in micro- and nanotechnology at Uppsala University, is another of Boule’s young talents.
“My education gave me an understanding of why materials have their properties, the function of the properties, and what methods can be used to analyze or manufacture materials with certain properties. Through this, many of the physical theories that describe the optical laser module of our 5-part instruments were already known to me. For example, the type of light scatter that is used to analyze the contents of a blood cell and how to direct the cell through the laser light to succeed in analyzing its contents. I started my position as a System Engineer at Boule immediately after graduation and have been with the company since 2018. Working in a broader, international R&D team, especially with the scientists at CDS, have given me insights in both work methodology and engineering. Although there are challenges in being a small, growing company, there are also many advantages such as opportunities for individual responsibilities and for developing as a professional. With a broad technology interest, the wide range of work tasks suits me well.”
Jesper Söderqvist, CEO of Boule Diagnostics since 2020 (Fig 18), shares his vision for the future of the company:
We are proud of our history. More importantly, we challenge ourselves to create greater impact in the future. I joined Boule in an extremely interesting phase. We have clear growth ambitions and are expanding our sales in emerging markets. At the same time, we are making the largest investment in Boule’s history in a new product platform that we will use to build new products on, and over time, replace our entire product portfolio.
We have ambitions and resources to innovate, both our products and our business. We are well positioned in a very dynamic market where new technology is reshaping healthcare in many ways. Boule plan to excel in clinical excellence and use technology to increase the value of our solutions. The future is digital and connected. New functionality will be implemented in our solutions. Moreover, it will change how we operate as a business in everything from supply chain to marketing and sales. The future holds many promises, with many opportunities for all employees to grow and develop new skills.
I am really excited about working with all our staff to develop Boule to an innovative growth company, that reflects our roots as a pioneer in blood cell counting. We plan to further grow our global reach so that we touch more lives and increase value for all our stakeholders, in our quest to improve health for everyone, everywhere.

Fig 18. Jesper Söderqvist, CEO of Boule Diagnostics.