Clinical performance of the Swelab Lumi hematology analyzer compared with a reference instrument
Hematological tests are widely used to support the diagnosis and monitoring of blood-related conditions, including anemia, infections, and certain malignancies. While manual microscopy remains a reference method for detailed cellular and morphological evaluation, automated hematology analyzers are routinely used for complete blood counts (CBCs) and white blood cell (WBC) differentials in clinical laboratories. Automated systems also allow assessment of a broader range of hematological parameters in a standardized manner.
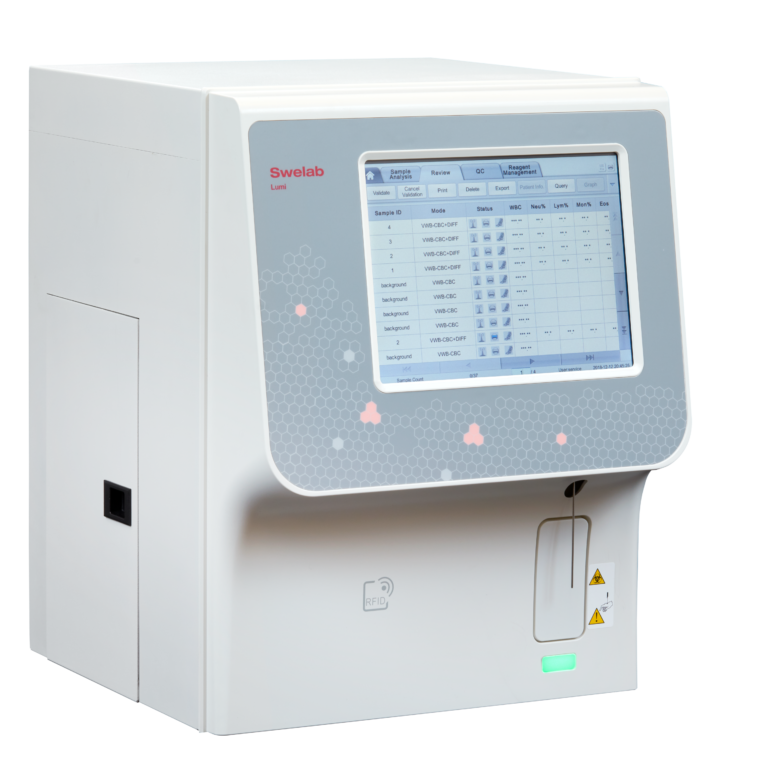
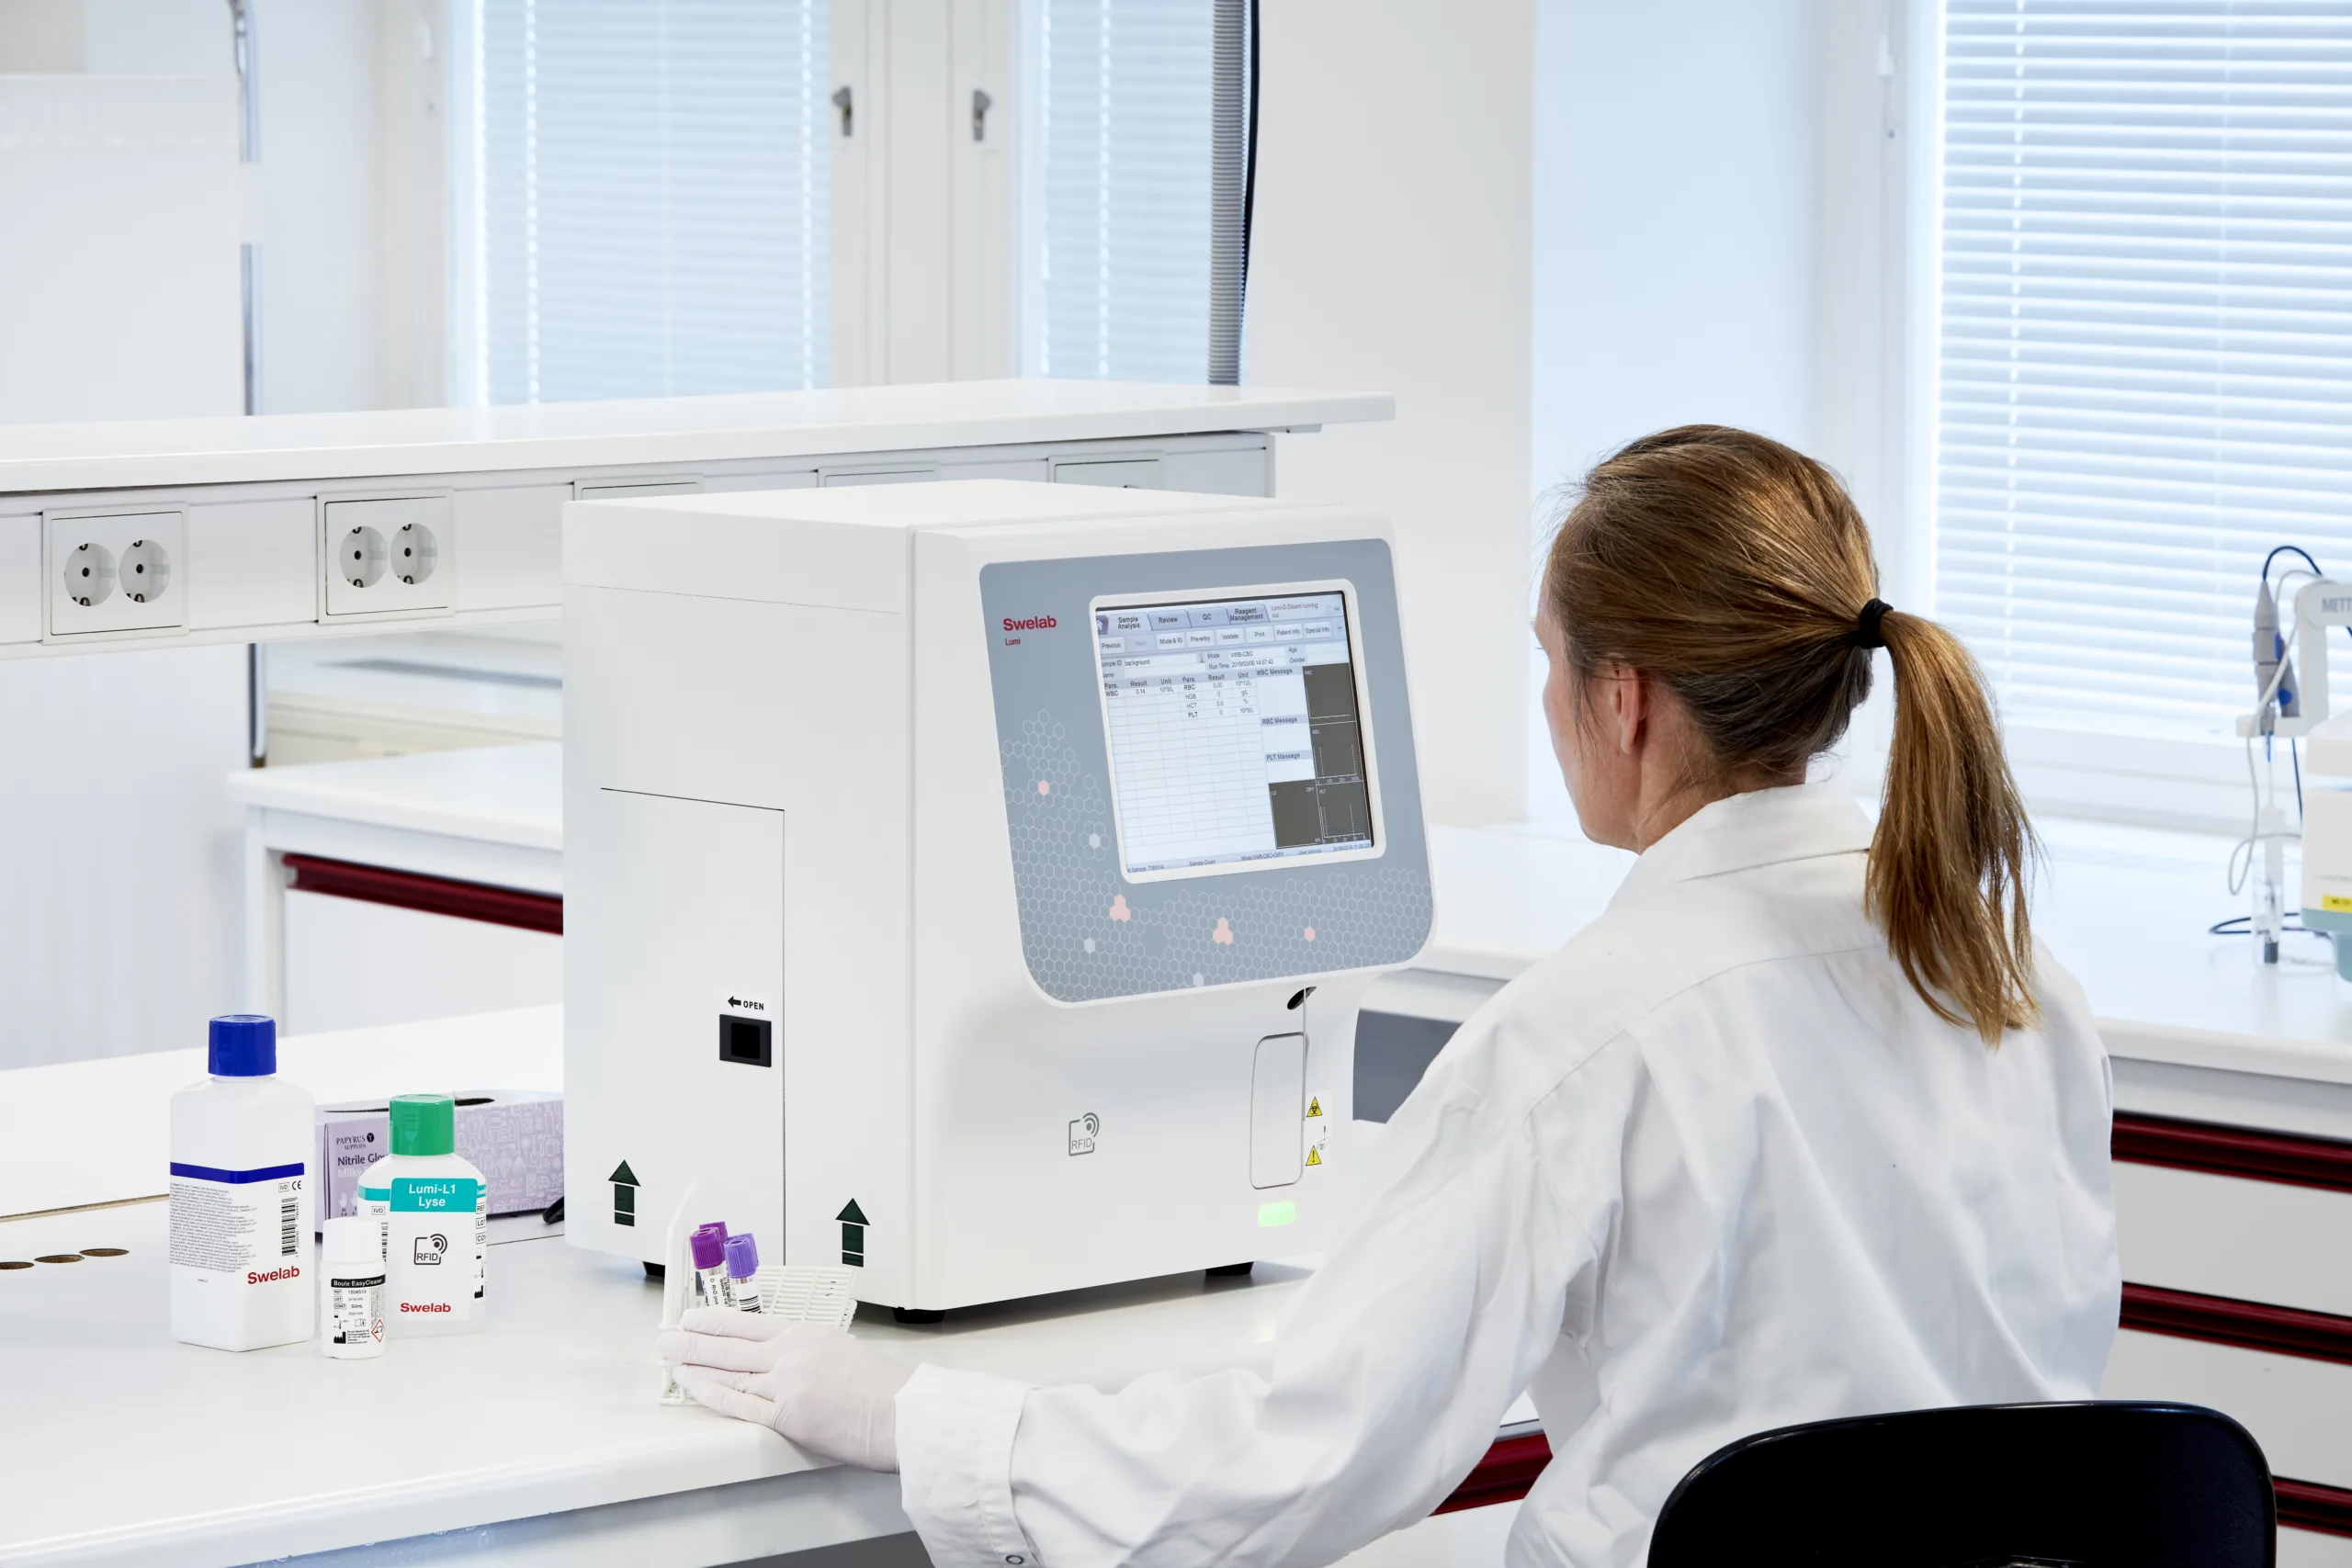
Swelab Lumi is a 5-part hematology analyzer from Boule Diagnostics (Figure 1). The analyzer reports 29 parameters, including 20 parameters intended for in vitro diagnostic (IVD) use and 11 parameters for research use only (RUO). Reported parameters include red blood cells (RBCs), platelets (PLTs), hemoglobin (HGB), and a 5-part differential of white blood cells (WBCs).
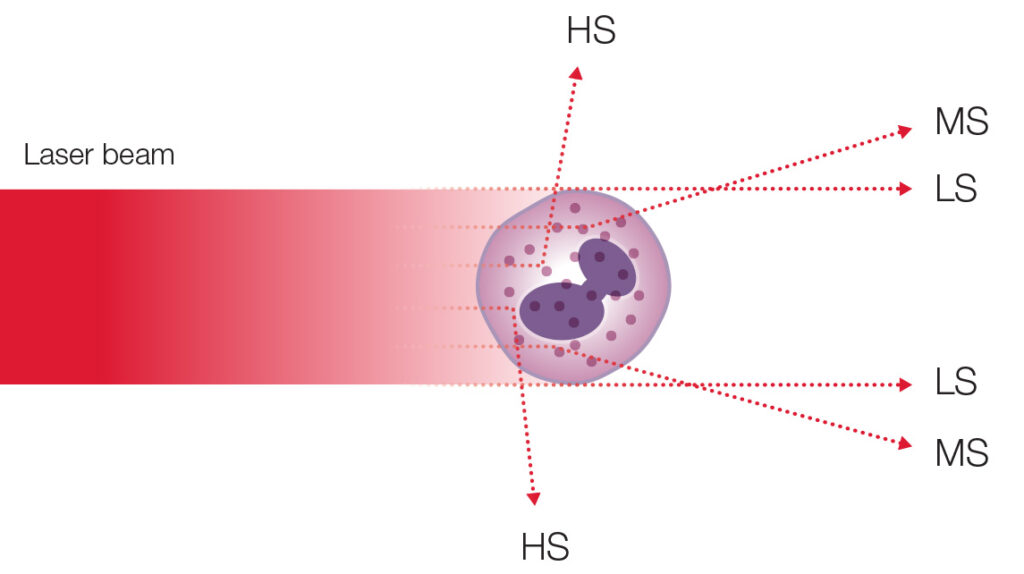
Like most hematology analyzers, Swelab Lumi uses electrical impedance for CBC measurements and spectrophotometry for hemoglobin determination. Measurement principles for WBC differentials vary between analyzers. Swelab Lumi applies a tri-angle laser scatter method for the 5-part WBC differential (Figure 2).

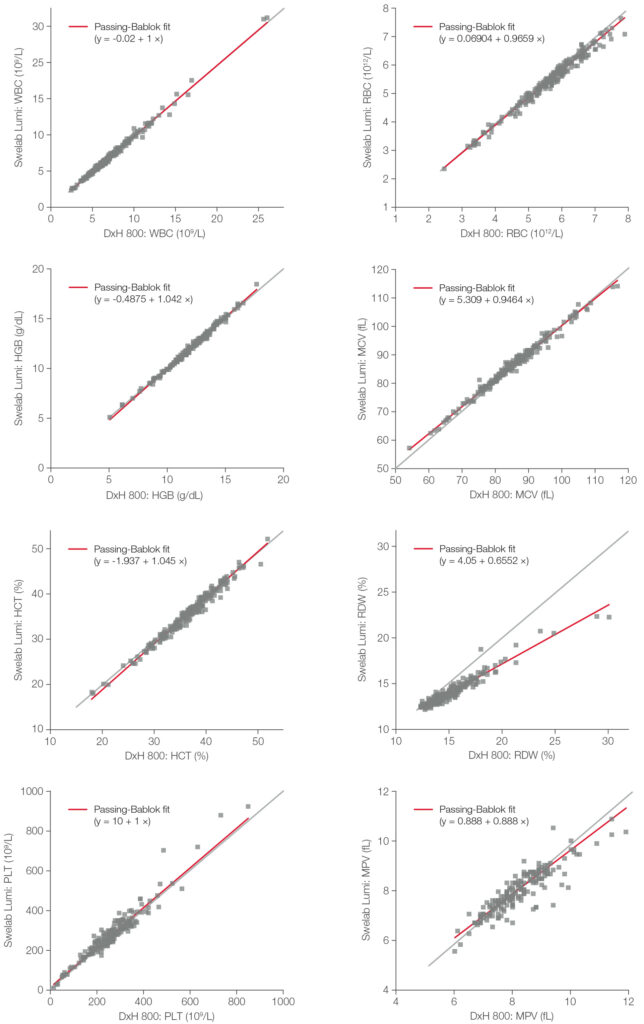

Comparison of test and reference system with manual microscopy
The WBC differential results obtained using the test and reference analyzers showed good agreement with manual microscopy, with the exception of basophils (BASO) and monocytes (MONO). At high WBC concentrations, differentiation of leukocyte subpopulations can be challenging for automated analyzers.
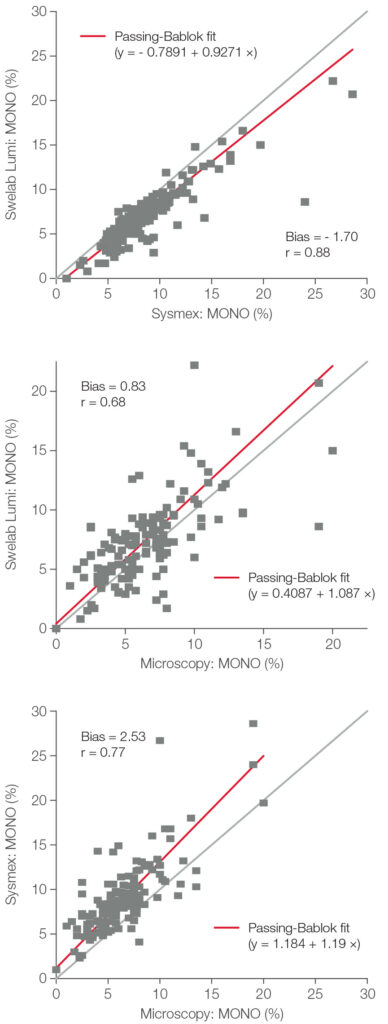
As illustrated for MONO counts (Figure 4), exclusion of samples with WBC values above 50 × 10⁹/L improved correlation between systems. Although a bias between analyzers was observed, Swelab Lumi results were closer to manual microscopy than those obtained with the reference analyzer in this comparison. As clinical laboratories are required to establish and maintain their own reference intervals, such calibration practices may mitigate observed biases.