Clinical performance of Swelab Lumi hematology analyzer compared with reference instrument
Hematological tests can be used to help diagnose and monitor numerous blood-related conditions, including anemia, infections, and certain forms of cancer. Although manual microscopy is often considered the ultimate method for cellular and morphological analyses, automated hematology analyzers are routinely used for complete blood counts (CBC) and white blood cell (WBC) differentials in clinical laboratories. In addition, automated analyzers can provide much more information than a manual count.
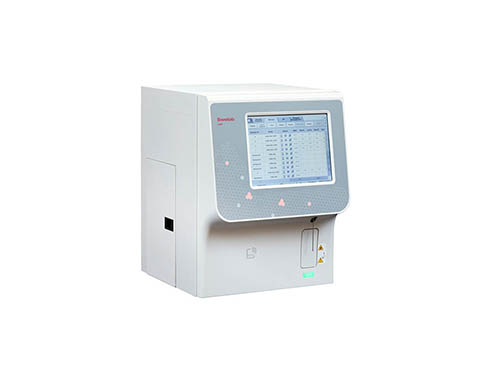
Swelab Lumi is a 5-part hematology analyzer from Boule Diagnostics (Figure 1). The analyzer provides information on 29 parameters—20 parameters for in vitro diagnostic (IVD) use and 9 parameters for research use (RUO) only—for the CBC, including red blood cells (RBC) and platelets (PLT), hemoglobin (HGB), and for the 5-part differential of white blood cells (WBC).
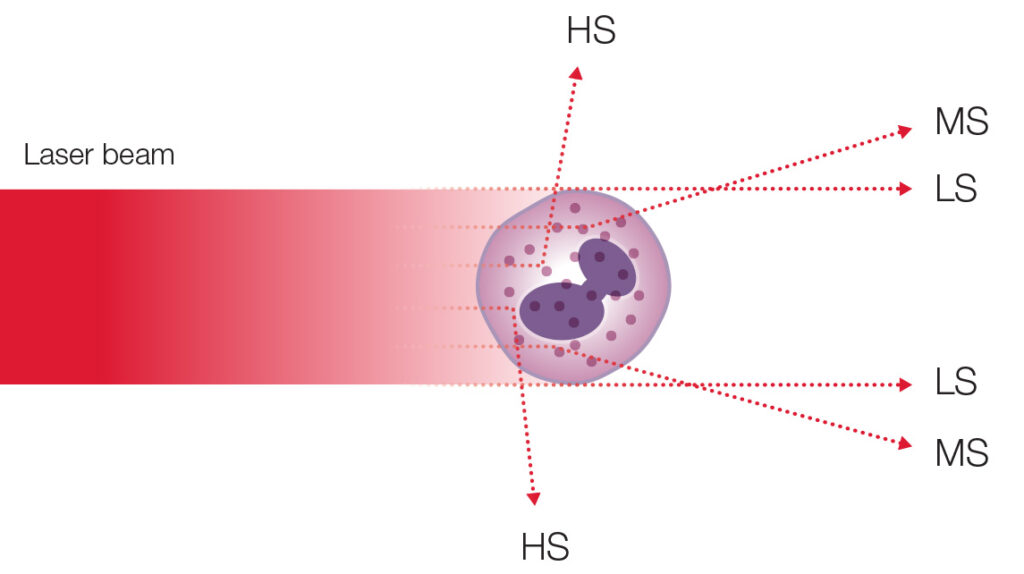
As most hematology analyzers, Swelab Lumi uses electrical impedance for CBC and spectrophotometry for determination of HGB. For the WBC differential, however, measurement methods differ between analyzers. Swelab Lumi uses a tri-angle laser-scatter method for the 5-part differential of WBC (Figure 2).


Comparison of test and reference system with manual microscopy
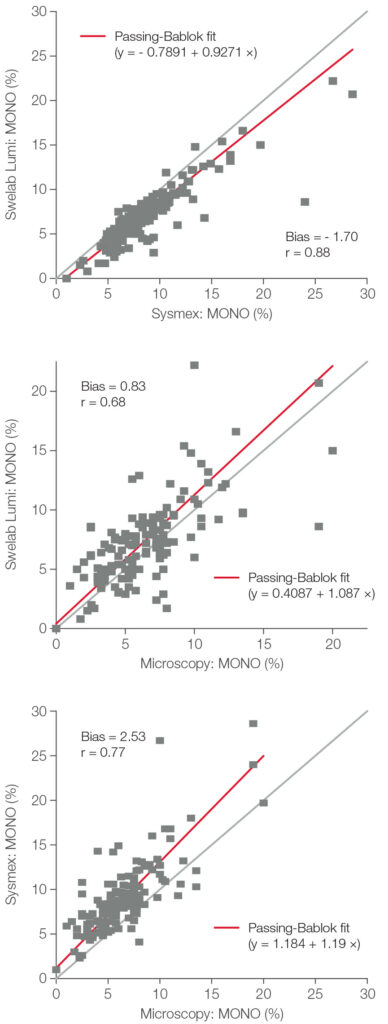
The WBC differential using the test and reference systems agreed well with manual microscopy, except for BASO and MONO. With high WCB counts, it can be difficult for the analyzer to differentiate the subpopulations. As shown for MONO in Figure 4, for example, when removing samples with WBC counts above 50 × 109/L, the correlation between the systems improves. Although a bias between the systems, Swelab Lumi was closer to manual microscopy than the reference system. As laboratories are obliged to establish and maintain reference intervals for measurands, this will mitigate the observed bias.
Learn more
Visit the product page for Swelab Lumi hematology analyzer.