Hematology analysis

A hematology analysis is usually the first test requested by a physician to evaluate a patient’s health status, and automated hematology analyzers are frequently used by clinical laboratories in general health screenings.
Blood cell formation
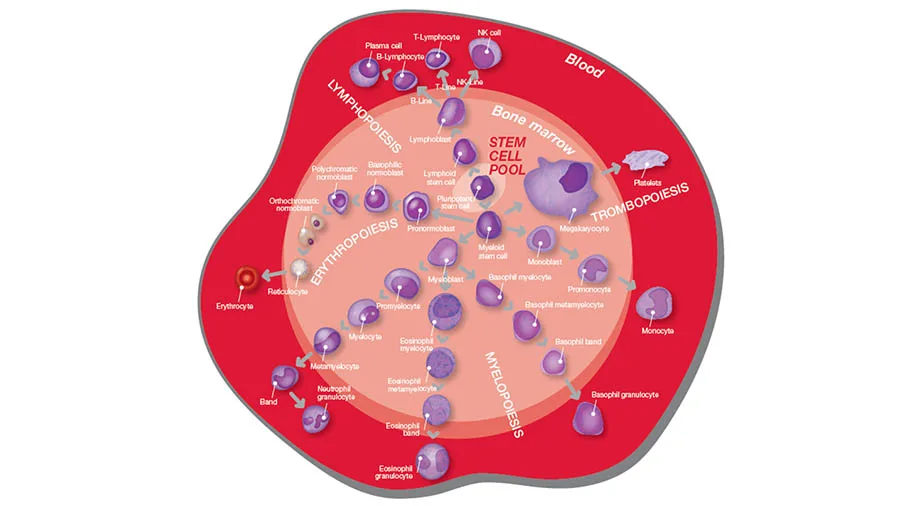
Through a process called hematopoiesis, blood cells are derived from pluripotent hematopoietic stem cells in the bone marrow, where they mature before being released into circulation (Fig 1).
In healthy adults, about one trillion (1012) new blood cells are produced every day, and a complete blood count (CBC) reflects the specific need for the different cell populations at a specific timepoint. A CBC is therefore commonly requested to assess and monitor patient’s health (Fig 2).
In addition to reporting the number of blood cells, an automated hematology analyzer also reports parameters related to cell volume and size and a range of calculated parameters. As part of the CBC analysis, a white blood cell (WBC) differential count is often conducted (Fig 3).
Abnormal and atypical cells
The release of mature cells into circulation and their migration to various tissues are the result of organs communicating through the endocrine signaling system. The presence of stem or progenitor cells in the bloodstream can therefore be an indication of a bone marrow failure. Additionally, many factors can make normal cells appear atypical, including inflammation and infection. Atypical cells can change back to normal cells if the underlying cause is removed or resolved.
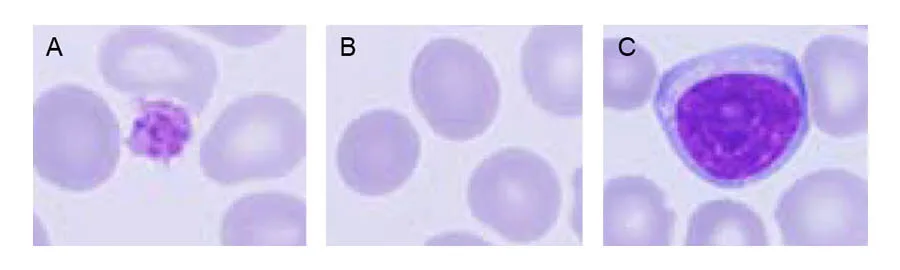
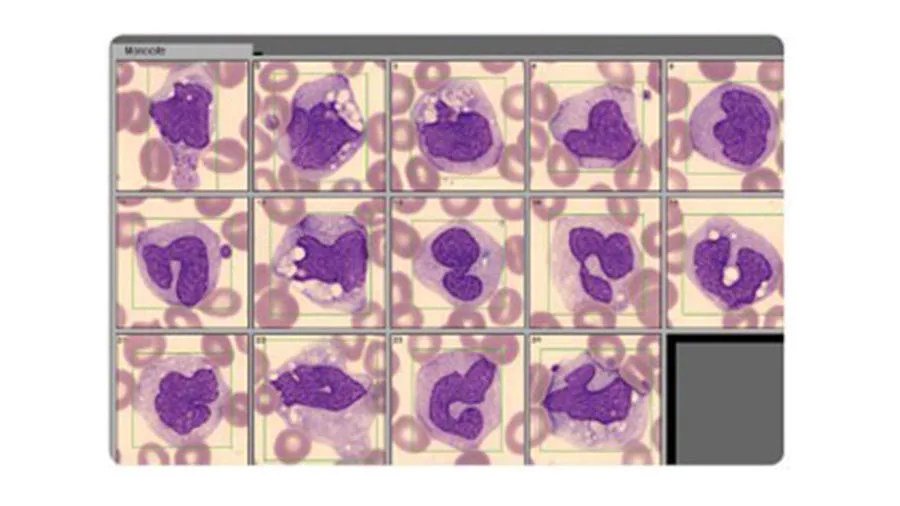
Abnormal or atypical cell variants can be difficult for a hematology analyzer to distinguish from normal cell populations. Blood smear analysis therefore remains an important diagnostic tool to determine immature or abnormal cells (Fig 4). Typically, you let the analyzer do the actual cell count, which is then confirmed under the microscope. At the same time, you can look for immature or abnormal cells.
WBCs of the immune system
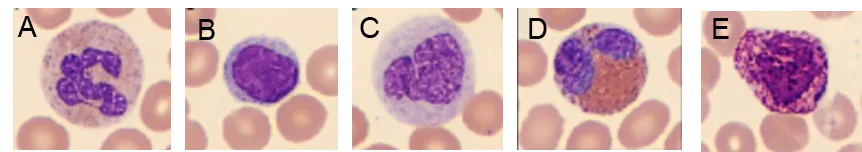
Lymphocytes (LYM) such as B cells, T cells and natural killer (NK) cells are all necessary for the control of a viral infection. A high LYM count can therefore be an indication of a virus infection. Monitoring the LYM count during a virus infection can also give information about the body’s response to the infection.
Neutrophils (NEU), eosinophils (EOS), and basophils (BASO) are three types of granulocytes (GRAN). They all contain granules that are filled with proteins responsible for helping the immune system fight off infections. Typically, a high NEU count is associated with a bacterial infection.
A WBC differential count can therefore answer the question of a viral infection or a bacterial infection that can be treated with antibiotics (Fig 5). A high number of white blood cells can also be an indication of certain forms of cancers, such as leukemia or a lymphoma.
RBC indices and anemia
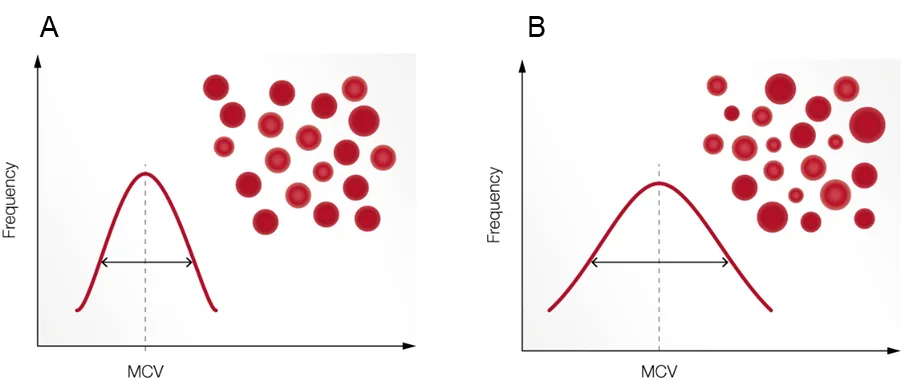
Anemia is a condition of poor oxygenation of the body’s tissues due to a low number of functional RBC and is reported as a low HGB or hematocrit (HCT, packed cell volume). RBC parameters related to the cell HGB content, cell volume, and variation in cell size are termed red cell indices. These values are useful, for example, when investigating the cause of an anemia (Fig 6). The red cell indices can be calculated if the values of HGB, HCT, and RBC count are known, and variation in the size of red cells can be quantified and expressed as red cell distribution width (RDW).
PLT indices
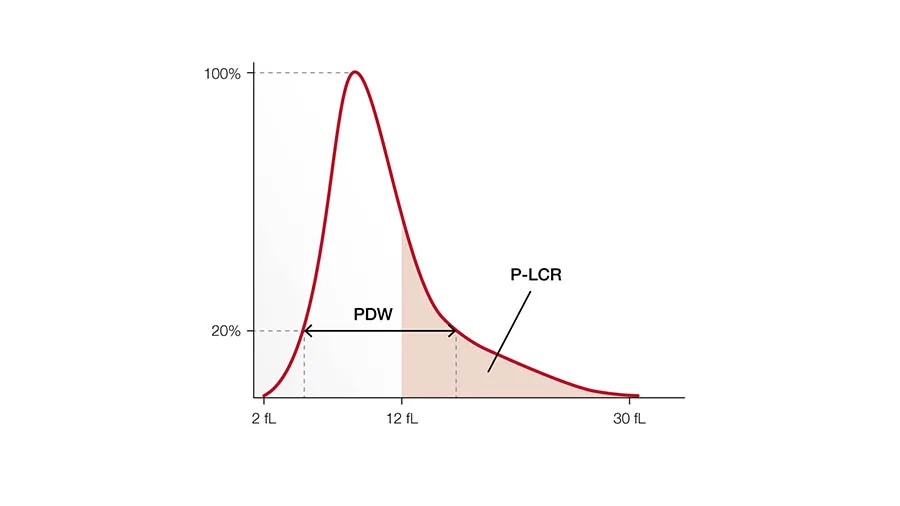
The primary function of PLTs is to prevent bleeding. They interact with each other and other cells, such as WBCs and vascular endothelial cells, to search for sites of injury, where they become activated. When stimulated, their surface area increases, and bioactive molecules are secreted (Fig 7). Platelets also seem to be involved in other functions such as the inflammatory process and the microbial host defense.
The PLT indices are used in evaluation of PLT function or production disorders. Studies have shown that the platelet indices can also be useful in determination of the severity of illness of patients under intensive care.
Hematology 3-part analyzers versus 5-part analyzers
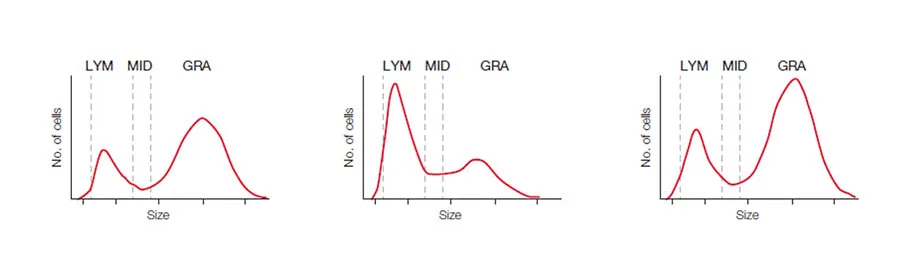
Hematology analyzers are commonly divided into 3-part and 5-part systems. A 3-part system differentiates white blood cells based on cell size into LYM, GRAN, which mainly constitute the NEU, but can also include EOS and BASO, and MID cells, which mainly comprise the monocytes (MONO). In addition to the CBC that can give an indication of anemia, blood clotting problem, or an ongoing infection, a 3-part analyzer will also answer the question of a viral or a bacterial infection (Fig 8A).
A 5-part system, which differentiate the WBCs into all five subgroups, will provide more detailed information on conditions such as allergies and parasite infections that can be manifested as high EOS and BASO counts (Fig 8B).
Measurement technologies
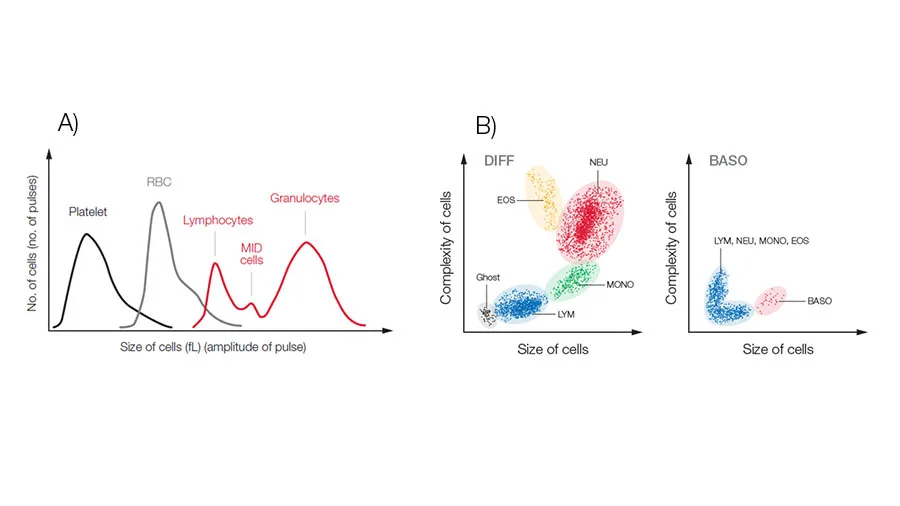
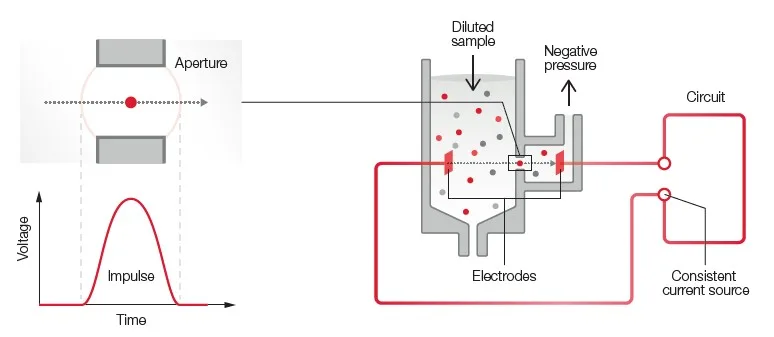
Both 3-part and 5-part analyzers use impedance for the RBC and PLT counts (Fig 9). A 3-part analyzer uses the same impedance technology for the 3-part WBC differential.
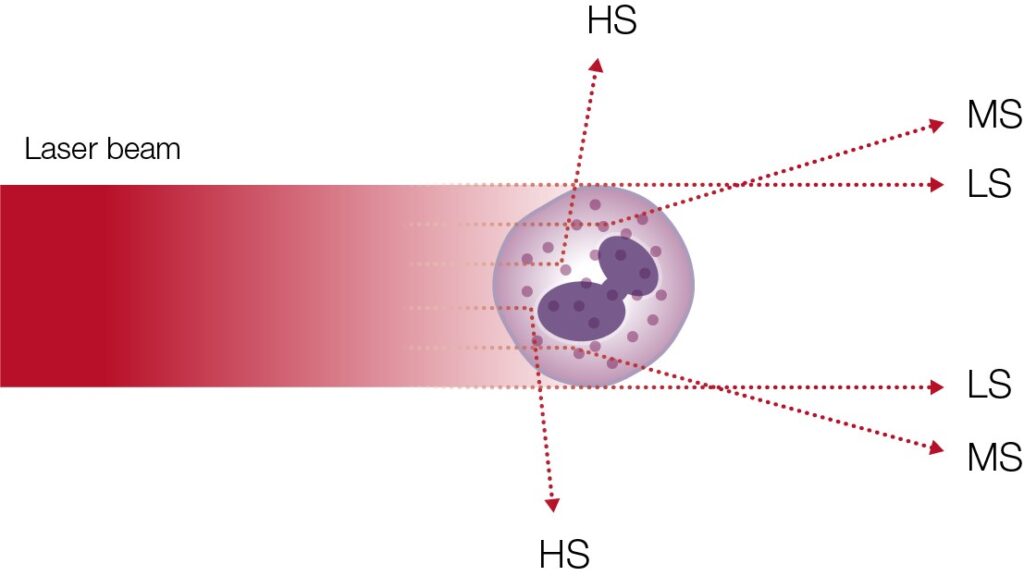
A 5-part analyzer typically uses laser-based flow cytometry for the differentiation of the WBCs (Fig 10).
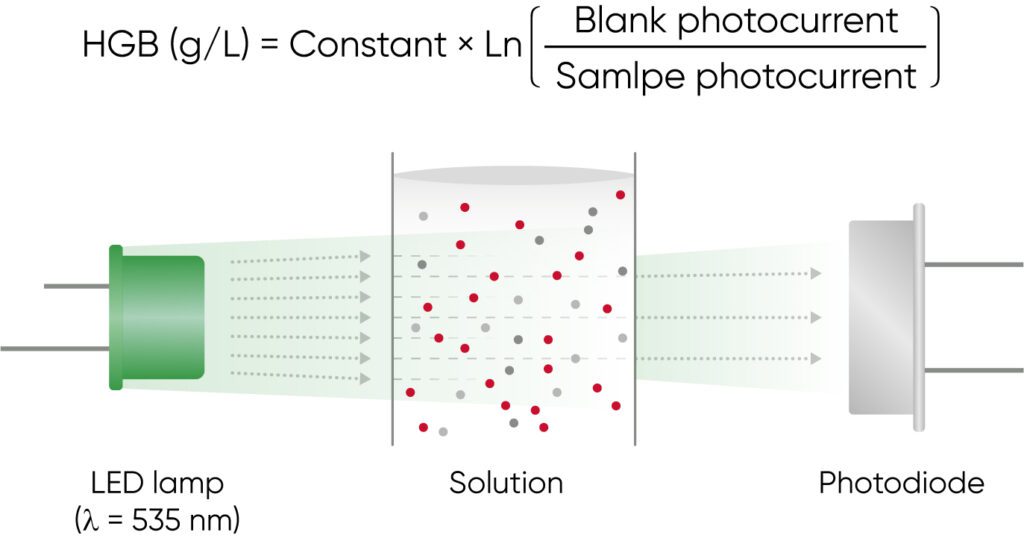
Both 3-part and 5-part analyzers use photometry for determination of the HGB concentration (Fig 11).
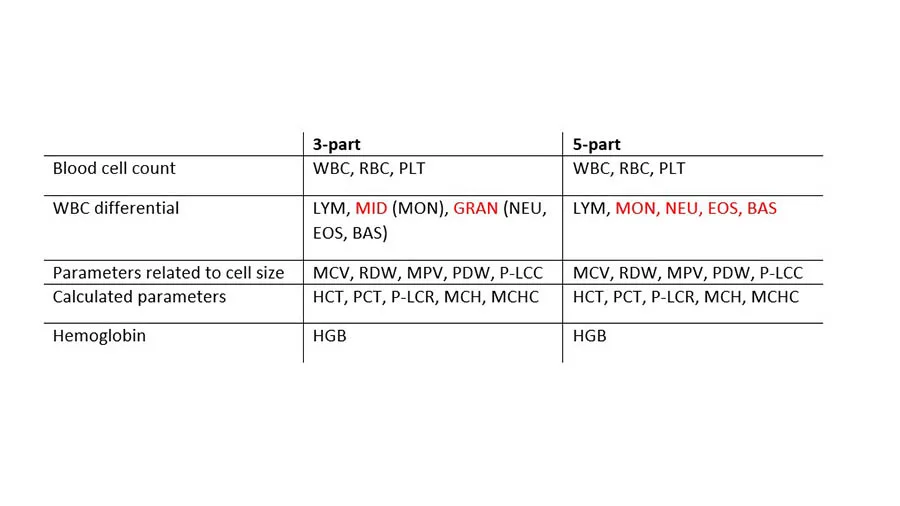
Although the difference between 3- and 5-part analyzers in how they differentiate the WBCs, the rest of the basic hematology parameters are essentially the same (Table 1).
Conclusion
For most cases, the same decisions can be made with a 3-part system as with a 5-part system. Regardless of analyzer type and often, guidelines often dictate that abnormal sample values must anyway undergo manual examination by microscopy, especially when a sample is flagged by the analyzer as suspicious. The more detailed information provided by the 5-part analyzer, however, can reduce the number of flagged samples that will require microscopic examination.
A 3-part analyzer based on robust impedance technology might require less maintenance than a 5-part instrument, which also includes the more sensitive laser-based measurement technology. A 3-part instrument is therefore often cheaper, but still provides excellent precision for general screenings.
With a 5-part analyzer, accuracy for abnormal samples can be improved. A 5-part analyzer is therefore typically used by hospital laboratories or, for example, by oncology clinics that can justify the higher cost associated with this type of system.
Regardless of the choice of a 3-part or a 5-part instrument, however, of utmost importance is the ability of the analyzer to detect and flag for abnormal samples.
Learn more about Boule: