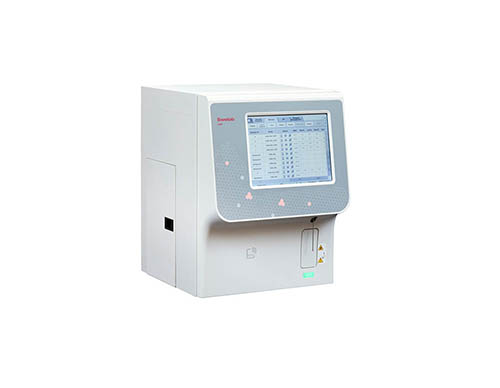
Performance comparison of Swelab Lumi hematology system with a reference system intended for use in large hospital laboratories

Fig 2. Agreement between cell count in the Swelab Lumi test and DxH 800 reference (Beckman Coulter) hematology analyzers. Passing-Bablok regression graphs are shown for (A) WBC, (B) RBC, (C) HGB, (D) MCV, (E) HCT, (F) RDW%, (G) PLT, and (H) MPV. In regression plots, the gray line is the line of identity (x = y) and the red line is the line of best fit.
