Veterinary classifications and investigation of non-regenerative and regenerative anemia and the role and clinical relevance of reticulocytes
One of the most common diagnosis globally among both human and veterinary patients is anemia.
A critical differentiator to make once anemia is diagnosed, is whether the anemia is regenerative or non-regenerative. Earlier, the only screening method was through manual microscope, but with today’s technologies and automated hematology analyzers you also have screening for anemia through various parameters. Through assessing different parameters obtained from a hematology analyzer, one may come closer to obtaining the root cause for the anemia, as will be discussed throughout this paper together with the differences between species. Moreover, this paper will look at the various definitions of anemia and reticulocyte counts. Even though hematology analyzers may help in the screening of anemia, manual microscopy is still necessary today in validating numerical data generated by the automated analyzers as well as to obtain additional morphological information of for example the red blood cells (RBC) which no automated system today can assess.
What is anemia?
Anemia is a common diagnosis and defined as a too low oxygen carriage capacity of the red blood cells. The lowered ability of the blood to carry oxygen can be due to a lowered total Red Blood Cell (RBC) count, lower than usual hemoglobin (HGB) concentration or just an inability of the blood to efficiently transport oxygen.
Different types of anemia
Anemia can be classified into either regenerative or nonregenerative; regenerative anemia being where the body responds to the decrease in RBC mass through the bone marrow increasing the RBC production; non-regenerative anemia, where the response from the bone marrow is insufficient and not enough RBCs are produced.
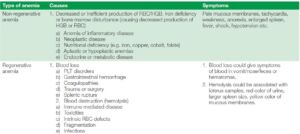
Table 1. Types of anemia and the underlying possible causes and symptoms associated (2)
Physical symptoms of anemia
Physical features of anemia include decreased appetite, increased heart rate and respiratory rates, pale mucous membranes, decreased strength, among others. Acute anemia may give very severe signs and symptoms to the patient even if the anemia is mild. Oppositely, chronic anemias can have milder symptoms due to adaptations of the heart and lungs to the chronic situation or even no symptoms in severe cases (1).
What causes anemia?
There are many factors that can cause anemia, some of the most common causes are mentioned below together with associated symptoms:
Reticulocytes
The RBC maturation is described and seen in figure 1 below. Reticulocytes (retics) is the last stage in the maturation of RBC’s and are characterized by being larger than the mature RBCs and have a nucleus containing RNA that can be stained blue. In dogs, retics take around 1–2 days to mature into red blood cells. Reticulocytes are generally found in the bone marrow, and when present in the blood usually indicates a response to the increase in a hormone erythropoietin (EPO), where the body is told to produce more RBC’s. This can occur due to blood loss, hemolytic conditions, etc. It is therefore important to see if an anemia is regenerative or not. High retics signifies regenerative anemia with a responsive bone marrow. If no anemia is present yet retics are high in concentration, this could potentially indicate low oxygen in the blood (hypoxemia).
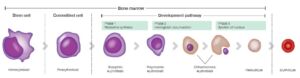
Fig. 1. Erythropoiesis and the various maturation stages of the RBCs.
Table 2 showing the various normal ranges for retics in the blood of various animal species. It is also important to note that there are variations between species, where for instance horses, cattle, goats and sheep do not have reticulocytes (1).
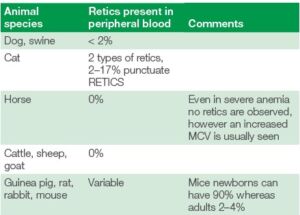
Table 2. Different species and their normal amounts of reticulocytes in the peripheral blood
Absolute retic count
It is also important to note that to determine the severity of the anemia and the regenerative response in dogs and cats, the reticulocyte percentage should not be used, but the absolute value. The absolute value can be counted using the formulas (2):
Absolute retic count (1000/uL) =
retic % (#/100) × RBC (mill/uL) × 1000
Or
Absolute retic count (1000/uL) =
retic % × RBC (mill/uL) × 10
An accurate RBC value can easily be obtained with an automated hematology analyzer, to be combined with the retics value obtained by manual microscopy of a methylene blue-stained blood smear
Corrected retic percentage
Another method to get a more accurate degree of severity of the anemia is to calculate a corrected reticulocyte percentage by applying the formula:
Corrected retics % = retics % × (patient’s HCT/normal HCT)
Here the normal HCT is assumed to be 45% for dog and 35% for cat. This method can easily be done without a hematology analyzer only using a microhematocrit centrifuge together with a methylene blue-stained manual smear. However, this corrected retic % does not take into account the maturation time of the retics (2).
Retic production index
To consider the maturation time of the retics and get a more accurate degree of severity of anemia one can calculate the production index of retics. This is calculated through:
Retic production index = corrected retic %/retic lifespan
The retic life span is based on the HCT value and this is commonly used in the human diagnostics but becoming more common in the veterinary world. A value > 1.0 indicates that the patient
has an increased reticulocyte production response to the anemia. See table 3 below for the retic lifespan value to use (2).
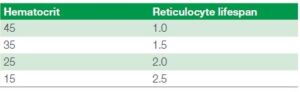
Table 3 showing the reticulocyte lifespan figure to use when calculating
the reticulocyte production index, based on the patient’s hematocrit value
As the reticulocytes mature, they lose more and more of their ribosomes. When they are more immature with lots of ribosomes aggregating and clumping together, they are known as aggregate reticulocytes. However, with maturation when very few ribosomes are present, they are known as punctuate reticulocytes. In most animals this difference has no clinical significance as they both have the same half-life when circulating in the blood. However, for feline samples it is very important to differentiate between punctuate and aggregate reticulocytes, as here the punctuate reticulocytes have a longer lifetime of around 10–12 days compared to the aggregate reticulocytes with lifetimes of about 12–48 hours
(3). Hence for cats, only the aggregate reticulocytes should be considered when investigating regeneration of anemia (including all the calculations above), see table 4.
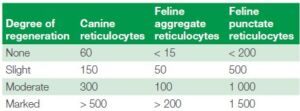
Table 4 showing the reticulocyte guidelines for the degree of anemia severity based on the absolute counts of reticulocytes for canines and felines, also separated into aggregate and punctuate reticulocytes for felines
It is very important remember that anemia should not only be classified based on retics. There are many other essential aspects of a patient’s blood screening and blood count that need to be investigated.
Examples include other signs in the RBCs of regenerative anemia:
• Nucleated RBCs
• Polychromasia – where the cytoplasm has a blue-pink color
• Anisocytosis – large difference in RBC sizes
• Basophilic punctuation
• Macrocytosis – Mean cell volume (MCV) increase
• Spherocytes
• Autoagglutination
• Heinz-bodies
• Eccentrocytes
• Blood parasites
• Howell-Jolly bodies – where left over nuclear pieces in the cytoplasm are observed
In case of anemia, all the morphologies of the RBCs should be checked under microscope. None of them can be identified by automatic hematology analyzers except anisocytosis (through RDW and RBC histogram) and macrocytosis (through a higher MCV).
Swedish guidelines recommend, for cats when the HCT is below 20%, for dogs less than 30%, a manual microscope check for RBC morphologies as well as a manual count of RETICS (1).
Typical anemia investigation protocol
To establish the prognosis of an anemic patient, the cause is needed to be found. This is usually found through patient history, clinical examinations, physical examinations and hematology parameters.
Various clinics and laboratories have their own different protocols for how they diagnose anemia. Below is a suggestion to an anemia investigation procedure (1):
1. CBC with emphasis on the RBC morphology, retics count (if applicable), RBC associated parameters (MCV, RDW, MCHC). Both automated hematology together with a manual smear.
2. PLT count or at least an estimate and total plasma protein (TP) should be measured.
3. Biochemistry profile and endocrine testing could be done to look for metabolic or endocrine disturbances. Here the liver, kidney and thyroid are of special interest.
4. Serum concentration of iron and total iron binding capacity (TIBC) are usually tested if inflammation or iron deficiency is thought to be the cause.
5. A biopsy of the bone marrow or an aspirate could be done if nothing is abnormal of the above and it is more useful for non-regenerative anemias.
6. Specialized tests for immune disorders could also be done if applicable (direct Coombs test, antinuclear Antibody test).
7. If hemorrhage is thought to be the cause, coagulation, fecal tests, iron assays and body fluid tests can be performed.
How Exigo™ H400 can help in anemia investigations
A hematology screening is always required to be a first step in an anemia investigation. It is a quick screening to get the overall hematology view and absolute values of the main cell populations. Here the RBC, HGB, HCT, MCV, MCH, MCHC and RDW are very important. The HCT is many times used as part of indicating how sever the anemia is. See table 5 below for some recommended intervals.
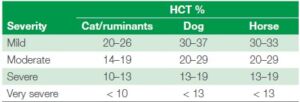
Table 5. Severity of anemia diagnosis through HCT% measure (1)
Important to remember is that the HCT will vary sometimes depending on breed, age or other factors of the patient. For instance, greyhounds tend to have a higher HCT (52-60%) whereas puppies and Saint Bernards tend to have a lower one (35-40% and sometimes below 30% even for puppies) (3).
MCV, being the mean cell volume, is also an important indicator in anemia investigations. If retics are present the MCV should increase, and MCHC decrease, as reticulocytes are in general larger than the RBCs. The MCV is especially important in horses where retics in the blood is usually not even seen
during regenerative anemia. Other important anemia related MCV findings can be for example iron deficiency which can cause microcytosis (lower MCV) or folate and vitamin B12 deficiency causing macrocytosis (increase in MCV). MCH, mean cell hemoglobin, usually follows the MCV value, except when it is an artifact due to old samples (increased MCV and MCH) or excess of EDTA (causing lower MCV and lowered MCH). There may be some factors that can cause MCH and MCHC to be falsely elevated, such as intravascular hemolysis and lipemia, where the HGB count will be falsely increased. Important here is to compare with the MCV which will not have been affected. An increased MCHC is always an artifact and can also be due to interference by Heinz-bodies, agglutination or excess EDTA. A lower MCHC can however indicate regenerative anemia (as immature RBC have less HGB) or iron deficiency anemia (2).
The RDW being the red blood cell distribution width gives you a good indication together with the RBC histogram of if there are reticulocytes present in the blood. The histogram may then become more right-shifted and wider. An increase in RDW and wider histogram can also occur with for instance microcytosis
in for instance iron deficiency, where you have a large number of smaller RBCs. See figure 2.
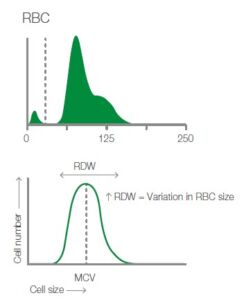
Fig. 2. Depicting the TBC histogram from Exigo H400 and showing how the RDW is measured together with cell frequency and size.
Case study
Case study from Boule’s veterinary case book (4).
Immune-mediated hemolytic anemia, IMHA,
with auto-agglutination, thrombocytopenia and hyperfibrinogenemia in a dog.
A 1-year-old German Shepherd dog had been treated for ear infection and blisters on its nose earlier. Now it had been staggering and even collapsed without reason. A blood transfusion was given. This blood sample was taken 4 days after admission. A 3-part analysis was decided to run, as it was an anemia
investigation and the eosinophil count was not necessary.
The dog had autoagglutination of RBC, which causes various errors because RBC are not evenly distributed in the sample. Blood smear evaluation revealed the presence of monocytosis and band neutrophils that increased the MONO cell count and also merged into the granulocyte population.
Table 6 and figure 3 showing the laboratory data of the CBC results from the hematology analyzer along with the histograms as well as the manual count performed.
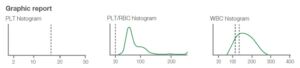
Fig. 3. Graphic report 4 days after admission. Note the upper platelet histogram has only a hint of platelets shown at about 5 fL. Note the end of the middle PLT-RBC histogram has an upward turn at the right end. This may suggest autoagglutination. The bottom WBC histogram lacks a distinct separation of the LYM and GRAN populations. The differential is therefor marked with an LM flag.
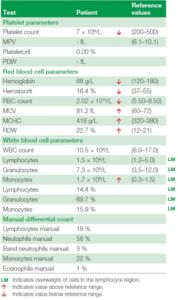
Table 6. The numerical results from patient. Results indicate an increased MONO cell population. Samples that have this type of cell distribution, with
an alarm flag for the WBC differential count and with an increased LYM or MID cell count, should always prompt a manual review of a blood smear.
Interpretation
The case illustrates that autoagglutination causes errors in several hematologic tests both in an instrument and with manual counting because cells are not evenly distributed and individualized. The presence of severe thrombocytopenia and large platelets also causes error in the platelet count. Very large platelets may be too large to be counted as platelets. If most platelets are of normal size and the percentage of unusually large platelets is small, the error is small and likely does not affect clinical decisions. Both the automated and manual platelet counts gave the same conclusion of severe thrombocytopenia. The dog was diagnosed as having immunemediated hemolytic anemia (IMHA). The most specific evidence for IMHA in this case was the presence of autoagglutination (Fig 5). It was then treated with glucocorticoids and the anemia disappeared during treatment. However, IMHA is usually a very regenerative anemia but no polychromasia was seen on the smear. The dog had an increased MCV (81 fL; macrocytosis). Plasma fibrinogen was greatly increased (9.8 g/L) in this dog, and hyperfibrinogenemia causes increased rouleaux. Prominent rouleaux can give erythrocyte agglutination, which can be confused with autoagglutination. This is more common in horses which have greater hyperfibrinogenemia than small animals. Thus, it is important to dilute the EDTA blood out with at least 5 times more saline to be certain the clumping is not due to rouleaux. Rouleaux should disappear after dilution with saline and mixing. Rouleaux and hyperfibrinogenemia is due most often to inflammation, while autoagglutination is very specific for antibodies on the erythrocytes and IMHA.
The dog had been transfused earlier, which may have caused autoagglutination of the transfused RBC. A transfusion reaction may cause autoagglutination and immune mediated removal of RBC but does not prove that the dog had IMHA before the transfusion.
The blood transfusion the dog received the previous day increased the microhematocrit from 9 % that day to 26% the day of this sample. The instrument’s hematocrit was 16% but may have been in error due to the autoagglutination. With autoagglutination, the erythrocytes in the instrument are not
evenly distributed. They remained in aggregates. This causes several errors including the high MCHC. No anisocytosis was seen on the blood smear. There were large platelets (Fig. 4).
This indicates active thrombopoiesis. The instrument did not give out all platelet data because of the very low number of platelets. The lack of platelets is seen in the top graphic, which is the platelet histogram. The manual thrombocyte count on that day was only 32 × 109/L, which verifies there was a true
thrombocytopenia. Thrombocytopenia is common in IMHA due to either immune-mediated platelet damage or disseminated intravascular coagulation (DIC). The dog had elevated D-dimer at 2.9 mg/L (reference < 0.25), which strongly indicates DIC or thromboembolic disease. DIC in haemolytic anemia is due in part to all the necrotic debris from damaged erythrocytes. If the dog had an incompatible blood transfusion reaction, this could cause DIC.
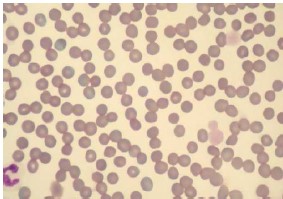
Fig. 4. This case did not have the polychromasia, anisocytosis or the
spherocytosis expected in immune-mediate hemolytic anemia. The
erythrocytes were fairly uniform. Note also the thrombocytopenia with the
remaining thrombocytes being very large. Two thrombocytes (platelets)
had a diameter larger than erythrocytes.
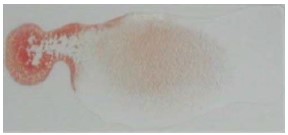
Fig. 5. There was distinct autoagglutination even after diluting the blood
1:5 with saline. In this figure drop of whole EDTA blood is at the left and
it was mixed with 5 drops of saline on the right. There is a concentration
gradient of blood that decreases from left to right. There was still gross
agglutination at the far right in very dilute suspension.
The manual granulocyte count would be 56 % segmented neutrophils plus 3 % band neutrophils and 1 % eosinophils for a total of 60 %. The automated granulocyte count was 70 %. The automated lymphocyte count was 14 % and the manual count was 18 %. The automated monocyte count was 16 % and the manual monocyte count was 22 %. Thus, the automated differential gave a similar picture as the manual differential leukocyte count. Monocytosis is common in hemolytic anemia because of the need of macrophages to remove damaged RBC. Monocytes become macrophages in the tissue.
Conclusion
Anemia is one of the most common diagnosis globally for both animals and humans at small to medium sized clinics. It is essential to know whether the anemia is regenerative or non-regenerative and to find the root cause a combination of going through patient history, clinical examinations, physical examinations and hematology parameters is needed. Different laboratories have their own established protocols for how they do their anemia investigations. Although, microscopy is required for specific RBC
morphologies, automated hematology analyzers are a great screening tool that can give a lot of valuable
information for anemia investigations.
References
1 Gröndahl, G. Veterinary Hematology – An introduction. Boule Diagnostics, 33267, Edition 4 (2019).
2 Eclinpath, Cornell University College of Veterinary Medicine. Accessed, February 2020.
3 Tvedten H. Basic approach to Anemia Diagnostics, World small animal veterinary association world congress proceedings, (2005).
4 Gröndahl G., Tvedten H. Veterinary hematology case book, Boule Diagnostics, 35310, Version 1.
Definitions
Macrocytic: MCV above the reference interval.
Normocytic: MCV within the reference interval.
Microcytic: MCV below the reference interval.
Hyperchromic: MCHC above the reference interval. Usually a false increase (not a true in vivo finding), e.g. lipemia can falsely increase the hemoglobin concentration relative to the HCT, thus falsely increasing the MCHC.
Normochromic: MCHC within the reference interval.
Hypochromic: MCHC below the reference interval
PDF download
White paper: White paper Anemia Investigation_WPE_35331-2