Gain workflow efficiencies and cost benefits in hematology testing at point of care
A complete blood count (CBC) is often the first laboratory diagnostic test requested by a physician to assess a patient’s health condition. With today’s technology advancements, such a test is typically conducted in a physician’s office laboratory (POL) setting, using small, space-saving hematology analyzers. For abnormal samples, microscopic examination is commonly required to confirm the results obtained with the analyzer. For this, the blood sample is traditionally sent to a hematology laboratory for a manual cell count. To minimizes pre-analytical errors, hemolysis, and blood clotting, however, the sample should ideally be analyzed within a couple of hours. This paper describes an evaluation study, demonstrating that considerable workflow efficiencies can be achieved with CellaVision® DC-1 digital cell morphology assessment when implemented in a distributed laboratory network. The automated digital imaging system generates high-quality images that can be shared for consultation by off-site expertise. Cost-benefits with combining 3-part hematology testing with digital cell morphology assessment are discussed (Fig 1).
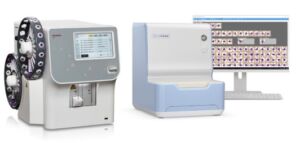
Fig 1. Erythropoiesis and the various maturation stages of the RBCs.
Introduction
Hematology is the medical discipline that covers studies and treatment of blood disorders. The science dates back as far as to the ancient Egypt and the practice of bloodletting. In the 1670’s, however, the field gained a breakthrough with the development of the high-magnification microscope by Antonie van Leeuwenhoek. Today, a complete blood count (CBC) is frequently requested by physicians to evaluate patients’ blood status. Traditionally, a laboratory technician uses a microscope to manually count the oxygen-carrying red blood cells (RBC), the platelets (PLT) that help clot the blood, and the white blood cells (WBC) of the immune system. As part of the CBC, a WBC differential is often conducted, in which 100 WBCs are differentiated into neutrophils (NEU), lymphocytes (LYM), monocytes (MONO), eosinophils (EOS), and basophils (BASO). Each cell type is reported as a percentage of the total WBC count, and a shift in the percentage indicates a condition.
In today’s general screenings, CBC tests are performed using automated hematology analyzers. In addition to reporting RBC, PLT, and WBC counts, the analyzer also measures the oxygen-containing hemoglobin (HGB) and determines a range of other parameters such as the mean cell volume (MCV), PLT width distribution (PDW), and hematocrit (HCT), that is, the red blood cell-to-plasma ratio. Hence, an automated analyzer can provide much more information than a manual cell count.
Blood cell formation and function
Through a process called hematopoiesis, blood cells are derived from pluripotent hematopoietic stem cells in the bone marrow, where they mature before being released into circulation (Fig 2). In healthy adults, about 1011–1012 new blood cells are produced every day. The cell production is growth factor-dependent and strictly regulated to maintain steady state blood levels. Abnormally high or low levels are associated with different types of disease conditions. Anemia, for example, is a condition in which the RBC count (and consequently also the HGB level) is below the normal range, resulting in insufficient oxygenation of the body’s tissues. A low PLT count (i.e., thrombocytopenia) causes difficulties for the blood to clot, resulting in an inability of the body to stop bleeding in the event of an injury. In normal blood, about 60% of the WBCs are NEUs. NEUs help fight bacteria (and fungi), and a high count (> 85%) indicates a bacterial infection. LYMs, accounting for about 30% of all WBC, help fight viruses. A high LYM count can therefore be an indication of a viral infection. The last 10% comprises MONO, EOS, and BASO. These cell types are typically associated with allergies or parasite infections. A high number of MONOs (2%– 8% normal), for example, can indicate a chronic inflammatory disease or a bacterial infection, whereas high EOS counts (1%–
4% normal) give an indication of asthma, an allergic reaction, or a parasite infection. A high number of BASOs (0.5%–1% normal) is typically associated with inflammatory reactions, especially those causing allergic symptoms.
Abnormal blood cells
The blood cell count reflects the specific need for the different cell populations at a specific timepoint (1). The release of mature cells into circulation and their migration to various tissues are the result of organs communicating through the endocrine signaling system, and the presence of stem and progenitor cells in the bloodstream can be an indication of a bone marrow failure.
Abnormal cell variants, such as immature or activated cells, can be difficult for a hematology analyzer to distinguish from the normal blood cell populations. Where an accurate count of such abnormal cells is precluded, their altered size and/or complexity can be used to indicate their presence in a system message (i.e., parameter flag). Irrespective of an absolute count or a parameter flag, when the CBC and/or WBC differential results are abnormal, manual examination of the sample by microscopy is typically required.
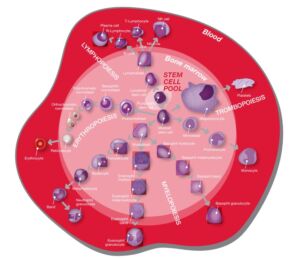
Fig 2. Blood cell formation from pluripotent hematopoietic stems cells in the bone marrow
Digital cell morphology assessment
While market trends point to an increase in diagnostic testing at the point of care (POC), reports indicate a limitation in qualified resources such as Medical Laboratory Technologists for support of POC programs (2). For microscopic examination, the sample is therefore often sent to a core hematology laboratory. To prevent degradation of cellular elements, however, the blood smear should be prepared as soon as possible, preferably within two hours from blood collection (3).
CellaVision is a provider of digital solutions for medical microscopy in the field of hematology. The company’s product portfolio includes analyzers that automate and rationalize the work that is traditionally done by laboratory personnel using conventional microscopes. For the past decades, CellaVision technology has revolutionized the way hematology laboratories around the world manage blood cell morphology assessments.
With the introduction of the DC-1 analyzer (available from Boule Diagnostics), the product offering was extended to meet the needs also of smaller laboratories (Fig 3). CellaVision DC-1 combines high-power microscopy, digital imaging, and AI- based image analysis. Through identification of the monolayer, location of individual cells, and capture of high-quality images, the analyzer provides a pre-classification of cells for convenient on-screen review. Connectivity facilitates collaboration between colleagues and simplifies consultation by off-site morphology experts.
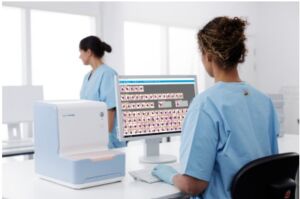
Fig 3. CellaVision DC-1 digital image analyzer enables standardizing the cell morphology assessment procedure for reliable and consistent results, while achieving high level of traceability and quality control.
Utility and impact of CellaVision DC-1
implemented in a distributed laboratory network
In a collaborative study conducted by CellaVision AB, Lund, SE and Calgary Lab Services, Calgary, CA, the impact of implementation of CellaVision DC-1 in a distributed laboratory network was explored (4). Calgary Lab Services is a medical diagnostic laboratory, serving a large catchment in Southern Alberta, Canada. The organization comprises more than 15 geographically dispersed laboratory sites, for which the high-throughput Calgary site serves as the central referral site for the smaller laboratories.
In this study, sample analysis time and turn-around time (TAT) of the local test site (High River) for blood smears referred to Calgary Lab Services was investigated. The investigation compared normal protocols, involving manual microscopy by High River Technologists using manual microscopy following subsequent transportation of smears to Calgary for review by a Pathologist, with DC-1 processing, including cell classifications by High River Technologists, with support from Calgary-based pathologists as required.
Results show that sample review times were considerably reduced using the DC-1 process as compared with normal protocols (Fig 4A). In addition, laboratory TATs for smears referred to Calgary were greatly improved (Fig 4B).
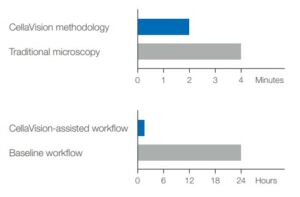
Fig 4. Considerable workflow efficiencies can be achieved by
implementing CellaVision DC-1 in a distributed laboratory network:
(A) sample review times were reduced by 50% and (B) TATs for smears referred to Calgary could be improved by 94% (published with kind permission from CellaVision AB).
Combination of a hematology analyzer with digital cell morphology assessment for workflow efficiency and cost benefits
A simple CBC will measure the oxygen-carrying RBCs, the oxygen-containing HGB, the PLTs that help blood clot, and the WBCs of the immune system. Depending on the differentiation of the WBCs, however, hematology analyzers are divided into 3-part systems and 5-part systems (5). In addition to a CBC, a 5-part instrument differentiates the WBCs into their five mains subgroups NEU, LYM, MONO, EOS, and BASO, while a 3-part analyzer combines NEU, EOS, and BASO into granulocytes (GRAN) (Fig 5). The NEU (or GRAN) and LYM counts will answer the question of a viral infection or a bacterial infection that can be treated with antibiotics Although each WBC sub-type provides information that helps diagnose blood-related conditions, a 3-part instrument will provide sufficient information for general screenings in a typical POL setting. For specialty laboratories, however, a 5-part instrument can provide a more detailed and targeted assessment of the blood status. To distinguish eosinophils and basophils from neutrophils, for example, a 5-part differentiation is mandatory.
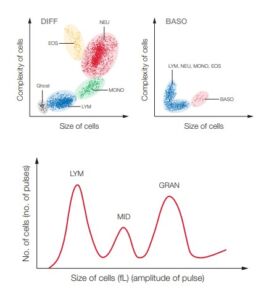
Fig 5. WBC differential test results from (A) a 5-part hematology analyzer, visualized in a 4-part differential scattergram for NEU, LYM, MONO, and EOS and a separate scattergram for BASO (Ghost = nucleated RBC, lyse-resistant RBC, and platelet clumps), and (B) a
3-part hematology analyzer, visualized in a histogram for LYM, MID cells (mainly MONO), and GRAN (mainly NEU, EOS, BASO)
However, the cost for a typical 5-part instrument can be two to three times higher (20,000 to 50,000 USD) than for a 3-part instrument (less than 10,000 USD). In addition, a 5-part differential often requires more reagents than a 3-part differential, also increasing the cost per test from below 1 USD/test for a 3-part differential to 1.5 to 3 USD/ test for a 5-part differential. Yet, government reimbursements commonly do not consider whether WBCs are differentiated into 3- or 5-parts. Hence, 5-part instruments are typically used by oncology or allergy clinics that can justify the need for eosinophil and basophil counts. In addition, a 3-part instrument based on robust impedance technology might require less maintenance than a 5-part instrument, which also includes a more sensitive laser-based measurement technology. Depending on local policies, samples that are flagged as abnormal commonly require microscopic examination to confirm the results obtained with the analyzer, regardless of instrument type. In such cases, CellaVision DC-1 provides automatic pre-classification of WBCs in just a few minutes. The cell sorting functionality allows review of cells in groups instead of individually. The reference data base facilitates confirmation or re-classification of pre-classified cells. The data base can be expanded with own reference cells. Screen view of high-resolution images facilitates cell review, without the risk of losing cell location upon interruptions. The on-screen presentation also allows for simultaneous review of cells by additional staff members. Its compact size makes the DC-1 analyzer suitable for laboratories where bench space is limited. CellaVision DC-1 is also suitable for educational use for competence enhancement.
Conclusion
Automatic pre-classification of WBCs can help shorten testing time, while improving resource utilization. Automating the microscopic examination of blood smears enables standardizing the procedure to deliver more reliable and consistent results, while achieving greater level of traceability and quality control. Connectivity facilitates sharing of images between laboratories and competencies. Access to reference cell images provides a tool for staff training and competency development. The combination of a 3-part hematology analyzer with digital cell morphology assessment can provide cost benefits, while reducing turn-around times for distributed laboratory networks.
References
1. Scheiermann et al. Regulation of leucocyte homeostasis in the circulation. Cardiovascular Research 107, 340– 351(2015).
2. Shaw, J.L.V. Practical challenges related to point of care testing. Practical Laboratory Medicine 4, 22–29 (2016).
3. Adewoyin and Nwogoh. Peripheral blood film – a review. Ann Ib Postgrad Med 12, 71–79 (2014).
4. Product evaluation summary: The implementation impact of CellaVision DC-1 in a distributed laboratory network. CellaVision, MM-140 (2019).
5. Whitepaper: Hematology analyzers – 3-part or 5-part, that is the question, Boule Diagnostics, 31183, Edition 2 (2019).