Investigation of veterinary anemia and the role of reticulocytes
Anemia is one of the most common diagnoses globally among both human and veterinary patients. It is a health state closely linked to the RBC indices, where low HCT and HGB are very strong indicators. To further investigate the root cause of the anemia, the clinician often expands the initial hematology assessment to include also a manual smear, to look at morphological changes in the RBC, and specialized tests, such as clinical chemistry.
What is anemia?
Anemia is a common diagnosis which is defined as a too low oxygen carrying capacity of the red blood cells. The lowered ability of the blood to carry oxygen can be due to a lowered total Red Blood Cell (RBC) count, lower than usual hemoglobin (HGB) concentration or just an inability of the blood to efficiently transport oxygen.
Physical symptoms of anemia
Physical features of anemia include decreased appetite, increased heart rate and respiratory rate, pale mucous membranes and decreased strength, among others. Acute anemia may give very severe signs and symptoms to the patient, even if the anemia is mild. Oppositely, chronic anemias can have milder symptoms due to adaptations of the heart and lungs to the chronic situation or no symptoms at all even in in severe cases (1).
Different types of anemia
Anemia can be classified into either regenerative or non-regenerative; regenerative anemia being where the body responds to the decrease in RBC mass through the bone marrow increasing the RBC production; non-regenerative anemia, where the response from the bone marrow is insufficient and not enough RBCs are produced. There are many factors that can cause anemia, some of the most common causes are mentioned below in table 1 along with the associated symptoms.
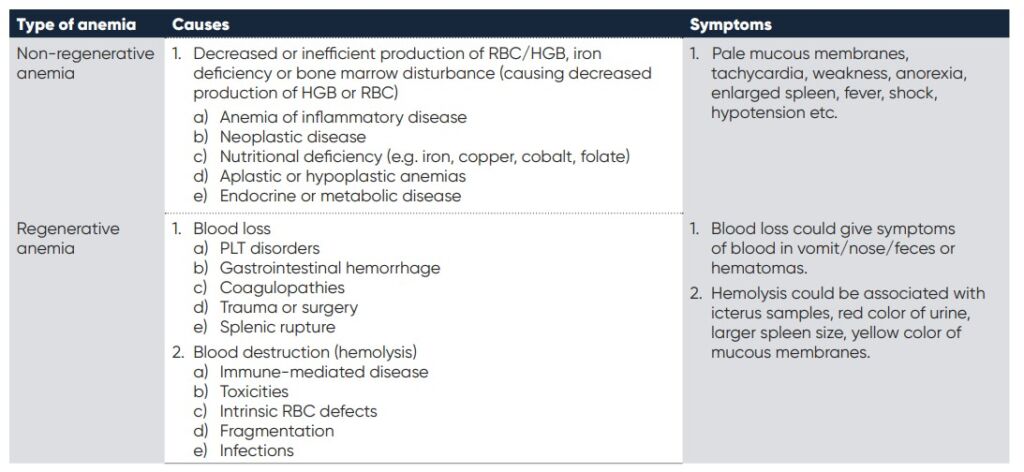
Table 1. Types of anemia, the underlying possible causes and associated symptoms. (2
RBC indices, as a reflection of anemia
As anemia is defined as a too low oxygen carrying capacity of the red blood cells, it is only natural that it is the red blood cell indices that is primarily used to diagnose the disease. To understand how these indices are related to the oxygen carrying capacity it is important to understand the maturation and function of the red blood cells.
The origin of the RBCs is the bone marrow, where hemocytoblasts are produced and matured into reticulocytes, see Fig. 1. The very last stage of the maturation is where the reticulocyte (RETIC) is differentiated into a mature erythrocyte (RBC) and released into the blood stream. In healthy individuals RETICs are mainly found in the bone marrow.
However, in the presence of a regenerative anemia, where the hormone erythropoietin (EPO) is increased and inducing the production of RBCs, the RETICs can also be found in the circulation. This can occur due to blood loss, hemolytic conditions, etc.
High RETICs signifies regenerative anemia with a responsive bone marrow. If no anemia is present yet RETICs are high in concentration, this could potentially indicate low oxygen in the blood (hypoxemia).
Reticulocytes (RETICs)
Reticulocytes are characterized by being larger than the mature RBCs and having ribosomal RNA that can be stained blue and visualized in a microscope. Because of the different size and composition of the RETICs, these can be recognized and distinguished from mature RBCs by automatic hematology systems. Some systems have a specific count of the RETICs, other systems see an indication of the RETICs through the RBC indices: MCV, RDW, MCHC and HCT.
Regardless if the system can provide a specific count of the RETICs or if the system indicates RETICs via the RBC indices, a manual smear should be performed to confirm the presence and also give further information on the overall morphology of the RBCs. It is also important to note that there are variations between species, where for instance horses, cattle, goats and sheep do not have reticulocytes (1), see table 2 showing the various normal ranges for RETICs in the blood of various species.
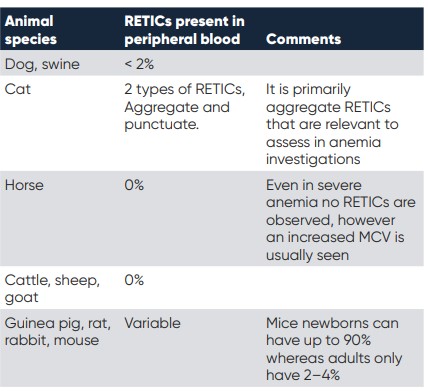
Table 2. different species and their normal amounts of reticulocytes in the peripheral blood.
RETIC count
There are several ways to calculate and present the RETIC count: Absolute RETIC count, RETIC % and corrected RETIC %. The RETIC % can either be achieved through a manual count or an automatic count, and presents the percentage of red blood cells that are reticulocytes. To obtain the actual number of reticulocytes, absolute RETIC, the percentage is multiplied with the number of RBC (2):
Absolute RETIC count (1000/uL) =
RETIC % (#/100) × RBC (mill/uL) × 1000
Or
Absolute RETIC count (1000/uL) =
RETIC % × RBC (mill/uL) × 10
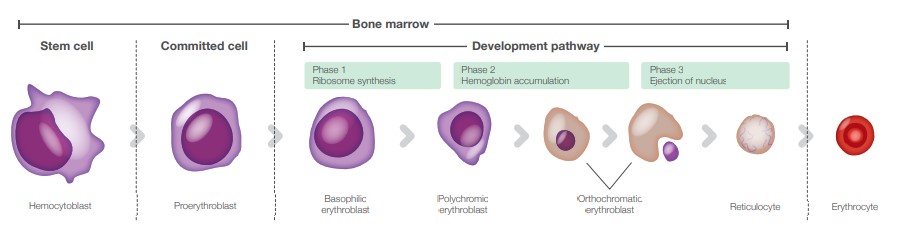
Fig. 1. Erythropoiesis and the various maturation stages of the RBCs.
In order to more accurately assess the severity of the anemia, the RETICs count can be corrected with the HCT:
Corrected RETIC % = RETIC % × (patient’s HCT/normal HCT)
Here, the normal HCT depends on the species assessed, for instance in dogs it is about 45% and in cats 35%. However, this corrected RETIC % does not take into account the maturation time of the RETICs (2). To also consider the maturation time of the RETICs and get an even more accurate degree of severity of the anemia, the RETIC production index can be calculated:
Retic production index = corrected RETIC %/RETIC lifespan
The RETIC life span is based on the HCT value, and is commonly used in the human diagnostics, but now also becoming more common in the veterinary world. See table 3 below for the RETIC lifespan value to use (2). A RETIC production index > 1.0 indicates that the patient has an increased reticulocyte production in response to the anemia.
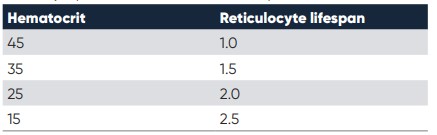
Table 3. The reticulocyte production index, based on the patient’s hematocrit value
Maturation of reticulocytes
As the reticulocytes mature, they lose more and more of their ribosomes. When they are more immature with lots of ribosomes aggregating and clumping together, they are known as aggregate reticulocytes. However, with maturation, when very few ribosomes are present, they are known as punctuate reticulocytes. In most animals this difference has no clinical significance, as they both have the same half-life when circulating in the blood. However, for feline samples it is very important to differentiate between punctuate and aggregate reticulocytes, as here the punctuate reticulocytes have a longer lifetime of around 10–12 days, compared to the aggregate reticulocytes, with lifetimes of about 12–48 hours (3). Hence for cats, aggregate and punctuate reticulocytes should be considered separately when investigating anemia (including all the calculations above).
RBC morphologies indicating regenerative anemia
It is very important to remember that anemia should not only be classified based on RETICs. There are also many other essential aspects of a patient’s blood screening and blood count that can contribute to the investigation.
The examples below include morphological signs of regenerative anemia.
• Nucleated RBCs
• Polychromasia – blue-pink coloration of the cytoplasm
• Anisocytosis – large differences in RBC sizes
• Basophilic punctuation
• Macrocytosis – increased mean cell volume (MCV)
• Spherocytes
• Auto-agglutination
• Heinz-bodies
• Eccentrocytes
• Blood parasites
• Howell-Jolly bodies – observation of left over nuclear pieces in the cytoplasm
In case of anemia, all the morphologies of the RBCs should be carefully checked under the microscope. Except for anisocytosis (through RDW and RBC histogram) and macrocytosis (through a higher MCV), it is very hard (or impossible) for automatic hematology analyzers to identify and count these morphologies correctly.
Indications of non-regenerative anemia
As previoulsy described, a non-regenerative anemia is a condition where the bone marrow does not respond to the need of increased production of RBCs. Hence, the indications of this type of anemia does not include RETICs nor the morphological changes described above. Instead, a non-regenerative anemia is often associated with a general low RBC and a low HGB, in the absence of RETICs.
Typical anemia investigation protocol
To investigate the cause and establish the diagnosis, the veterinary often combines multiple disciplines such as anamnesis, physical examinations, hematology parameters and other clinical examinations. Clinics and laboratories all have their own protocol on how to diagnose anemia, below is one example of an anemia investigation procedure (1):
General investigation
• CBC with emphasis on the RBC morphology, RETICs count and RBC associated parameters (MCV, RDW, MCHC). Both using an automated hematology system and with a manual smear.
• PLT count and total plasma protein (TP).
• Biochemistry profile and endocrine testing to investigate metabolic or endocrine disturbances. The liver, kidney and thyroid are of special interest.
Targeted investigation
• Suspected iron deficiency or inflammation: Serum concentration of iron and total iron binding capacity (TIBC).
• Suspected non regenerative anemia: Bone marrow biopsy.
• Suspected immune disorder: Specialized tests such as direct Coombs test, antinuclear antibody test.
• Suspected hemorrhage: Coagulation, fecal , iron and body fluid tests.
Exigo™ H400 in anemia investigations
Hematology screening is generally the first step in an anemia investigation. It is a quick screening to get the overall hematology view and absolute values of the main cell populations. The RBC indices: RBC, HGB, HCT, MCV, MCH, MCHC and RDW are of particular interest.
Hematocrit (HCT)
The HCT is the volume percentage of RBC in the circulation. A low HCT is a strong indicator for anemia and can also inform on the severity of the anemia, see table 5.
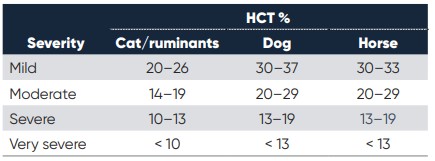
Table 5. Severity of anemia diagnosis through HCT% measure (1)
However, it is important to take into account that the HCT can vary depending on breed, age and other factors of the patient. For instance, greyhounds tend to have a higher HCT (52-60%) whereas puppies and Saint Bernards tend to have a lower one (35-40%) (3).
Mean cell volume (MCV)
MCV, reflects the mean size of the cells and is an important indicator in anemia investigations. Immature RBCs, such as reticulocytes, generally are larger in size than the RBCs and a presence of these would increase the MCV. This is especially important for horses where reticulocytes are very uncommon, but instead the regeneration is indicated by immature non-RNA containing RBCs, primarily detectable through an increased MCV. Other important anemia related MCV findings can be for example iron deficiency, which can cause microcytosis (lower MCV) or folate and vitamin B12 deficiency causing macrocytosis (increase in MCV).
Mean cell hemoglobin (MCH) and mean cell hemoglobin concentration (MCHC)
MCH, the average content of hemoglobin in each RBC, usually follows the MCV value. However, there are some factors that can cause MCH and MCHC to be falsely elevated, such as intravascular hemolysis and lipemia, where the HGB count will be falsely increased. It is then important to compare with the MCV, which will not have been affected. MCH can also be affected by the pre-analysis, where old samples can result in increased MCH, and excess of EDTA in a lowered MCH. An increased MCHC is always an artifact and can be due to interference by Heinz-bodies, agglutination or excess EDTA. A lower MCHC can however indicate regenerative anemia (as
immature RBC have less HGB) or iron deficiency anemia (2).
Red blood cell distribution width (RDW)
Together with the RBC histogram, the RDW, the variety in RBC size, provides a good indication of if there are reticulocytes present in the blood, see Fig 2. If reticulocytes are present, the histogram may become more right-shifted and wider. An increased RDW and wider histogram can also be accompanied by a left shift of the histogram. This is an indication of microcytosis, which can occur with for instance iron deficiency, where there is a large number of smaller RBCs present in the circulation.
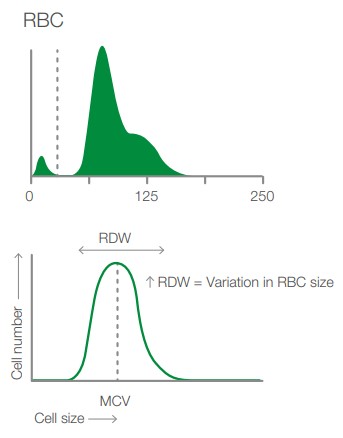
Fig. 2. Depicting the RBC histogram from Exigo H400 and showing how the RDW is measured together with cell frequency and size.
Case study
Case study from Boule’s veterinary case book (4).
Immune-mediated hemolytic anemia, IMHA, with auto-agglutination, thrombocytopenia and hyperfibrinogenemia in a dog
A 1-year-old German Shepherd dog had been treated for an ear infection and blisters on its nose earlier. Now it had been staggering and even collapsed without reason. The dog was admitted and a blood transfusion was given. Four days later a blood sample was drawn and an anemia investigation was initiated. As anemia was suspected, the focus of the investigation was the red blood cells, why a 3-part analysis was deemed fully sufficient.
Table 6 and Fig 3 show the laboratory data from the hematology analyzer, along with the histograms as well as the manual count performed. The hematology analyzer showed several irregularities, both for the RBC indices but also for monocytes, which were increased, and platelets, which were decreased. The abnormalities were confirmed by the manual smear, see table 6 and Fig. 4.
The high amount of irregularities in the blood count can be an indication of rouleaux or autoagglutination of red blood cells, where rouleaux is often due to inflammation, while autoagglutination is very specific for antibodies on the erythrocytes and IMHA. Testing show that plasma fibrinogen was greatly increased (9.8 g/L) in this dog, which could indicate erythrocyte agglutination due to rouleaux. To further determine the presence of rouleaux or autoagglutination, EDTA blood was diluted with saline. A rouleaux should disappear after dilution with saline and mixing, in this case the agglutination did not disappear, why autoagglutination was the established cause of agglutination, se Fig. 5.
Interpretation
This case illustrates that autoagglutination causes errors in several hematological parameters, both using an automatic analyzer and for manual counting, because cells are not evenly distributed and individualized.
The dog had been transfused earlier, which may have caused autoagglutination of the transfused RBC. However, although a transfusion reaction may cause autoagglutination and immune mediated removal of RBC, it does not prove that the dog had IMHA before the transfusion.
The hematology data showed several indications of anemia such as low hematocrit and increased MCV, however it did not show any polychromasia nor anisocytosis. The blood transfusion that the dog received improved the
microhematocrit, while the RBC data from the manual count and automated analyzer were disturbed due to the autoagglutination.
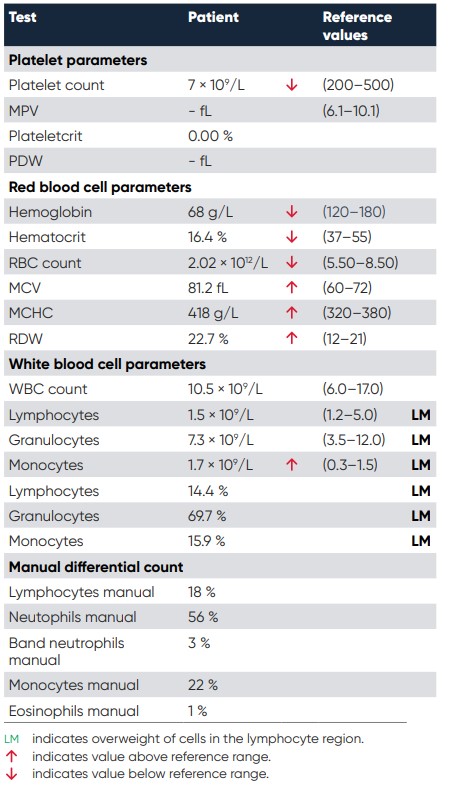
Table 6. Numerical results from the patient. Samples that have this type of cell distribution, with an alarm flag for the WBC differential count and with an increased LYM or MID cell count, should always prompt a manual review of a blood smear.
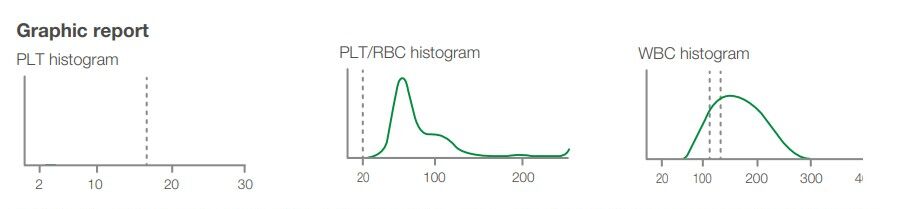
Fig. 3. Graphic report 4 days after admission. Note the left platelet histogram has only a hint of platelets shown at about 5 fL (not visible in the image). Note the end of the middle PLT-RBC histogram has an upward turn at the right end. This may suggest autoagglutination. The right WBC histogram lacks a distinct separation of the LYM and GRAN populations. The differential is therefor marked with an LM flag.
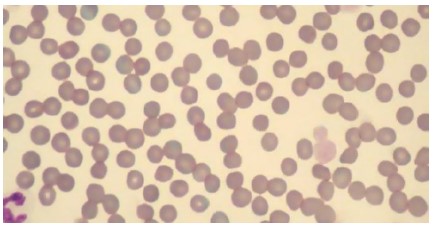
Fig. 4. This case did not have the polychromasia, anisocytosis nor the spherocytosis expected in immune-mediate hemolytic anemia. The erythrocytes were fairly uniform. Note also the thrombocytopenia with the remaining thrombocytes being very large. Two thrombocytes (platelets) had a diameter larger than erythrocytes.
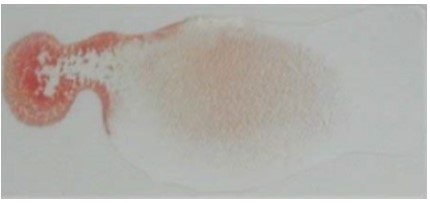
Fig. 5. There was distinct autoagglutination even after diluting the blood 1:5 with saline. In this figure drop of whole EDTA blood is at the left and it was mixed with 5 drops of saline on the right. There is a concentration gradient of blood that decreases from left to right. There was still gross agglutination at the far right in very dilute suspension.
The presence of severe thrombocytopenia and large platelets was observed both in the automatic count and manual inspection. The large platelets present and the high MPV, indicate active thrombopoiesis. Thrombocytopenia is common in IMHA due to either immune-mediated platelet damage or disseminated intravascular coagulation (DIC). The dog also had elevated D-dimer at 2.9 mg/L (reference < 0.25), which strongly indicates DIC or thromboembolic disease. DIC in haemolytic anemia is due in part to all the necrotic debris from damaged erythrocytes. If the dog had an incompatible blood transfusion reaction, this could cause DIC.
Monocytosis was established both using the manual count and the automated count, this is common in hemolytic anemia because of the need of macrophages to remove damaged RBC (monocytes become macrophages in the tissue).
The combination of thrombocytopenia (caused by DIC), monocytosis and auto-agglutination strongly indicates IMHA.
The dog was diagnosed as having immune-mediated hemolytic anemia (IMHA). It was treated with glucocorticoids which relieved the anemia.
Conclusion
Anemia is one of the most common diagnosis globally for animals and humans alike. It is essential to know whether the anemia is regenerative or non-regenerative and to find the root cause of the disease. To do this a combination of anamnesis (patient history), clinical examinations, physical examinations and hematology parameters is needed. Each laboratory have their own established protocols for how they do their anemia investigations, however they all include hematology testing.
Although microscopy is required for specific RBC morphologies, automated hematology analyzers are a great screening tool that can give a lot of valuable information for anemia investigations.
References
1. Gröndahl, G. Veterinary Hematology – An introduction.
Boule Diagnostics, 33267, Edition 4 (2019).
2. Eclinpath, Cornell University College of Veterinary Medicine.
Accessed, February 2020.
3. Tvedten H. Basic approach to Anemia Diagnostics,
World small animal veterinary association world congress
proceedings, (2005).
4. Gröndahl G., Tvedten H. Veterinary hematology case book,
Boule Diagnostics, 35310, Version 1
Download white paper Investigation of veterinary anemia and the role of reticulocytes as PDF