Automated hematology analysis: Understanding histograms and scattergrams
Introduction
Through a process called hematopoiesis, blood cells are derived from pluripotent hematopoietic stem cells in the bone marrow, where they mature before being released into circulation (Fig 1). In healthy adults, about one trillion (1012) new blood cells are produced every day. The release of mature cells into circulation and their migration to various tissues are the result of organs communicating through the endocrine signaling system. The presence of immature cells in the bloodstream can therefore be an indication of a bone marrow failure. Additionally, many factors can make normal cells appear abnormal, including inflammation and infection, and abnormal cells can change back to normal cells if the underlying cause is removed or resolved.
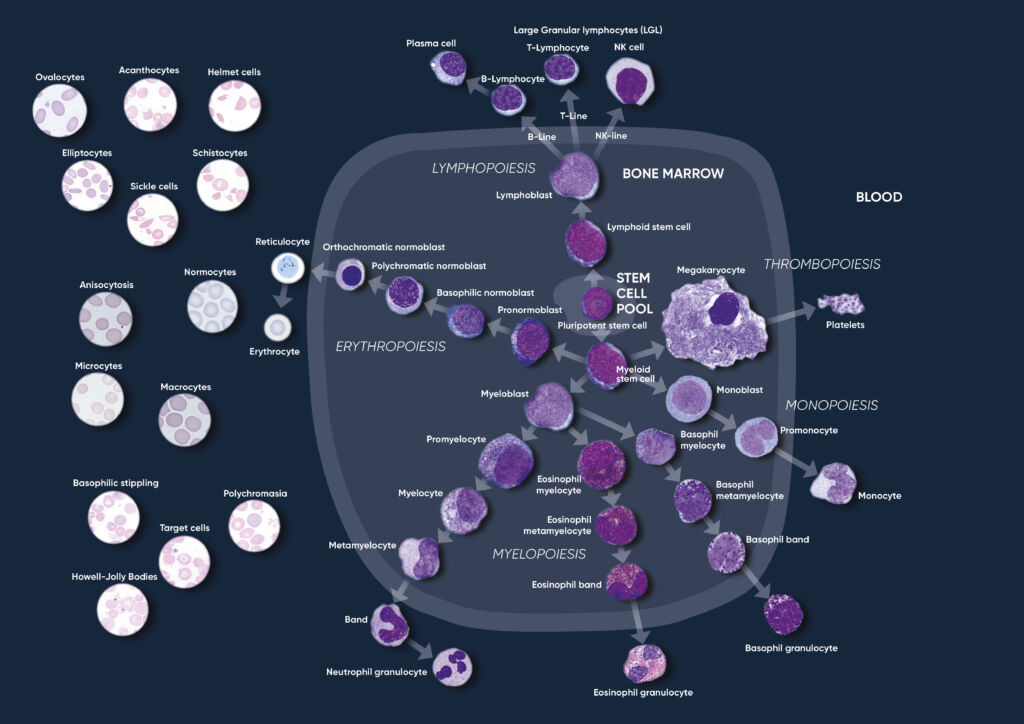
Fig 1. Overview of the hematopoietic blood cell production process (image created by Sigward Söderström and Helene Johansson, Örebro University Hospital, Sweden), which is growth factor-dependent and strictly regulated to maintain steady-state blood levels. Abnormally high or low levels are associated with different types of disease conditions.
A CBC test evaluates the cells in circulation, including the oxygen-carrying red blood cells (RBC), the platelets (PLT) that help clot the blood, and the white blood cells (WBC) of the immune system. The cell count reflects the specific need for the different cell populations at a specific timepoint.
Hemoglobin-rich erythrocytes are the most common blood cells (normal range ~ 4–6 × 10¹²/L). Their main function is to carry inhaled oxygen from the lungs to the tissues and organs of the body and remove carbon dioxide that is carried back to the lungs and exhaled.
The primary function of platelets (normal range ~ 130–400 × 109 /L) is to prevent bleeding. They interact with each other and other cells such as the WBCs and vascular endothelial cells to search for sites of injury, where they become activated.
As part of the CBC, a WBC differential count is often conducted. In normal blood, about 50%–70% of the WBCs are neutrophil (NEU) cells. NEUs help fight bacteria (and fungi), and a high count is often associated with a bacterial infection. Lymphocyte (LYM) cells, accounting for about 20%–30% of all WBCs, help fight viruses. A high LYM count can therefore be an indication of a viral infection. The last 10% comprises monocyte (MON), eosinophil (EOS), and basophil (BAS) cells. These cell types are typically associated with allergies and parasite infections. A high MON number (2%–8% normal), for example, can indicate a chronic inflammatory disease, whereas a high EOS count (1%–4% normal) can be an indication of asthma, an allergic reaction, or a parasite infection. A high BAS number (< 1% normal) is typically associated with an inflammatory reaction, especially such that causes allergic symptoms. High numbers of the WBCs can also be an indication of certain forms of cancers, such as leukemia or lymphoma.
In addition to reporting the blood cell counts, an automated hematology analyzer determines a range of other parameters, such as hemoglobin (HGB) content; parameters related to cell size such as the mean corpuscle volume (MCV), mean PLT volume (MPV), RBC distribution width (RDW), and PLT distribution width (PDW); as well as calculated parameters such as the mean red cell hemoglobin (MCH = HGB/RBC), mean red cell hemoglobin concentration (MCHC = HGB/HCT), hematocrit (HCT = RBC × MCV), and plateletcrit (PCT = PLT × MPV)
Automated hematology analysis results
The cell counts are performed in parallel cycles on the automated hematology analyzer (Fig 2). A dilutionreagent provides an isotonic environment for the RBC and PLT counts, while hemolytic reagents lyse the RBCs to release HGB and maintain the morphology of white blood cells to facilitate the counting of these cells. The results are presented as parameter values as well as in histograms and scattergrams, which are graphical representations of the numerical data of the different cell populations.
Histograms provide information about the average volume of RBC, PLT, and WBC cell populations, size distribution of the cell populations, and detection of subpopulations. The x-axis represents the volume of the cells in femtoliters (fL), whereas the y-axis represents their relative occurrence (number of cells) in percent (Fig 3). A normal histogram starts and ends on the baseline (Fig 4).
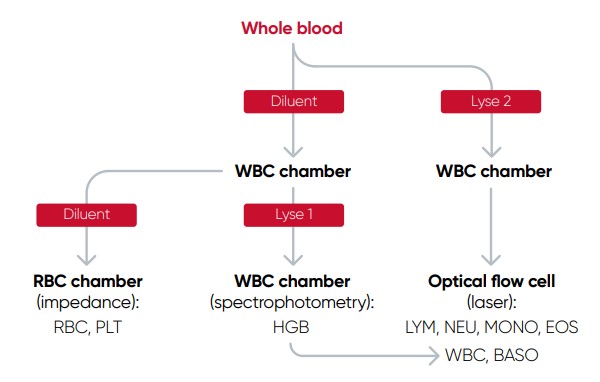
Fig 2. Measurement principle of Medonic™ M51 automated hematology system
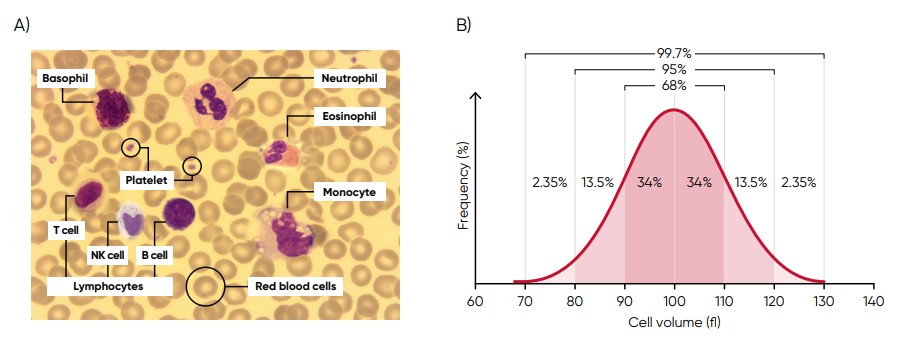
Fig 3. (A) Giemsa-stained blood cells photographed at 1000× magnification using a light microscope. (B) Cell variation in size within an individual population is called intra-individual biological variation. This variability has certain limits and is called Gaussian (or normal) distribution.
In a three-angle scattergram, the low angle signal represents the volume of the cells, the middle angle signal represents cell nucleus information, and the high angle signal represents cell nucleus and cytoplasm information (Fig 5).
The histograms and scattergrams constitute important parts of the results and should be carefully studied, as they provide valuable and important insights about the sample processed by the analyzer.

Fig 4. In Medonic M51, results for red blood cell (RBC), platelet (PLT), and white blood cell (WBC) counts are visualized in
histograms.
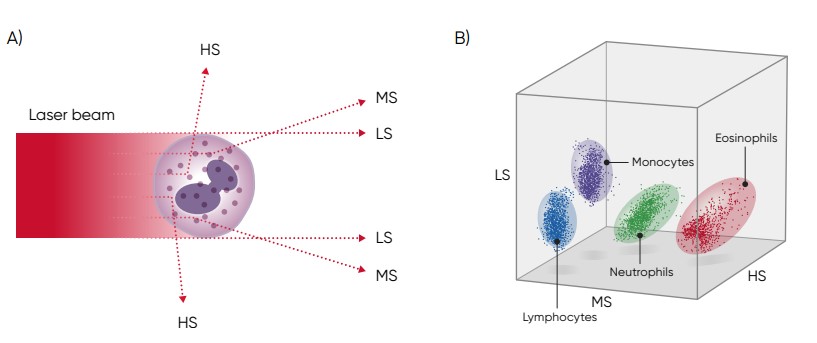
Fig 5. (A) Three-angle laser-scatter method, where the low angle signal (about 1° to 5°) represents the cell volume information, the middle angle signal (about 7° to 20°) represents the cell nucleus information, and the high angle signal (about 90°) represents the cell nucleus and cytoplasm information. (B) In laser-based WBC differentiation, cell distribution is displayed in a 3D diagram, with the low, mid, and high angle light scatter signals on the axes (scattergram).
The RBC histogram
From the RBC histogram, the MCV and RDW values are calculated from the area under the curve (Fig 6). MCV is the average RBC volume, while RDW provides information about the degree of variation in RBC size (Fig 7). Examples of erytrocyte abnormalities are shown in Figures 8 to 12.
Correct treatment of the blood sample prior to analysis is vital for the accuracy of the results. The blood sample must be less than eight hours old in order to obtain a correct WBC differential (Fig 13). The results are also affected if the sample is not allowed to rest for 15 min after drawing.
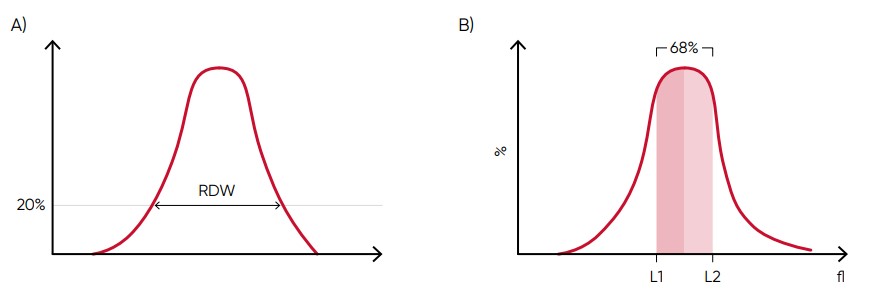
Fig 6. In Medonic M51, MCV is calculated as the sum of the size of all counted RBC pulses devided by the number of RBC pulses. (A) RDW-SD is the standard deviation of the average RBC size obtained by drawing an arbitrary line at a hight of 20% of the y-axis. (B) RDW-CV is calculated as 100 × (L2 – L1)/(L2 + L1).
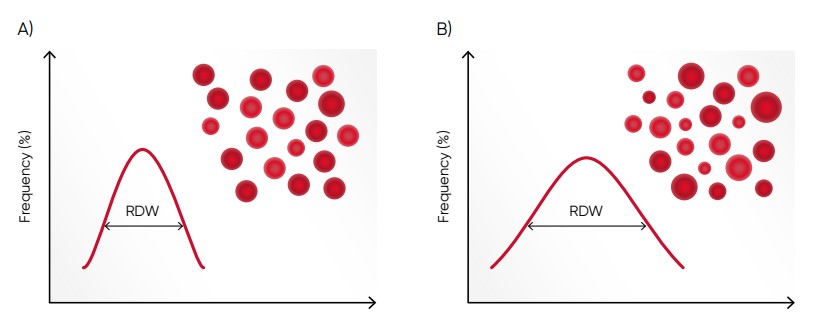
Fig 7. (A) Moderate anisocytosis (RDW 11%–20%). (B) Pronounced anisocytosis (RDW > 20%).
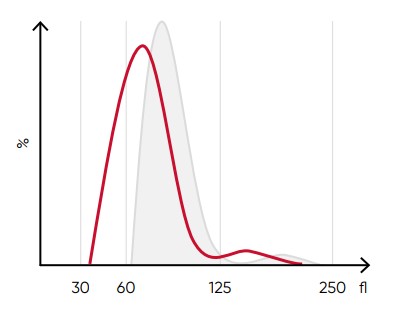
Fig 8. A shift of the RBC histogram to the left gives an
indication of microcytic RBCs (smaller than normal).
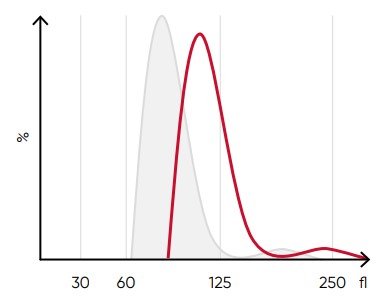
Fig 9. A shift of the RBC histogram to the right gives an indication of macrocytic RBCs (larger than normal).
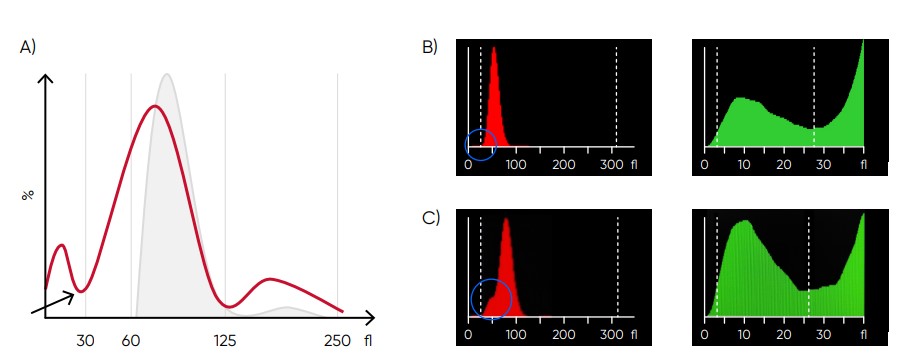
Fig 10. (A) Possible causes of an RBC histogram showing an abnormal high at lower discriminator can be RBC or WBC fragments, large (giant) PLTs, microcytic RBC, or PLT clumps. Action: check för PLT clumps on blood smear. (B) Medonic M51 RBC and PLT histograms, showing small particle interference. (C) Medonic M51 RBC and PLT histograms, showing cell fragments.
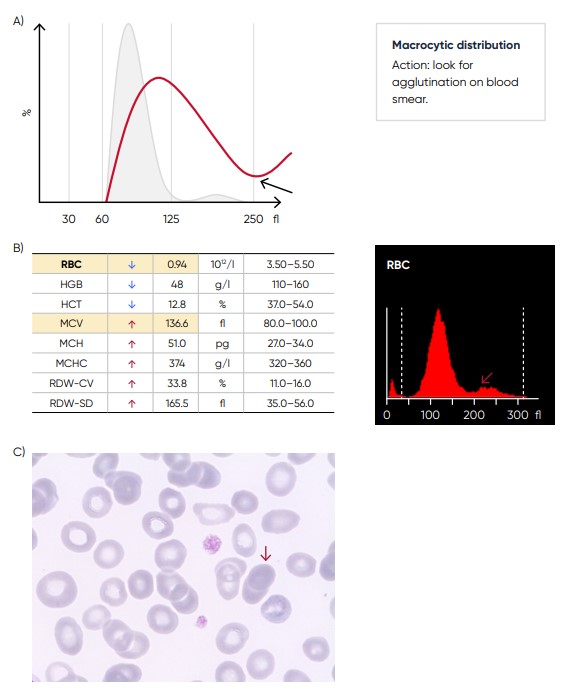
Fig 11. (A) Possible causes of an RBC histogram showing an abnormal high at upper discriminator can be RBC agglutination, cold agglutination, nucleated RBCs, or small LYMs, for example, due to chronic lymphocytic leukemia (CLL). Rule out cold agglutination by warming the sample at 37˚C for 15 min and re-analyze. (B) Medonic M51 results presented in numerical values and histogram from a sample with RBC aggregation (red arrow). (C) Microscopic image of RBC aggregation (red arrow).
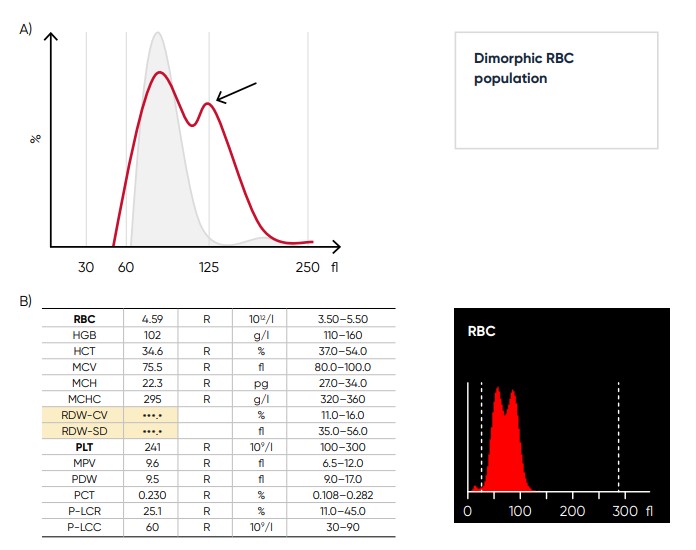
Fig 12. (A) Multiple RBC peaks (dimorphic population) can be a reflection of iron deficiency in recovery, dual-deficiency anemia (iron and vitamin B12/folic acid), or blood transfusion. (B) Medonic M51 sample results, showing dimorphic RBC peak.
Fig 13. Blood film from a sample that has been stored for too long, showing spiny RBCs (red arrow).
The PLT histogram
From the PLT histogram, the MPV and PDW values are calculated from the area under the curve (Fig 14). MPV is the average PLT volume, while PDW provides information on the degree of variation in PLT size. The PLT large cell ratio (P-LCR) is the amount of PLT particles larger than 26 fL in relation to the total number of PLT particles, and this value is used to calculate the PLT large cell concentration (P-LCC) (Fig 15). Examples of thrombocyte abnormalities are shown in Figures 16 to 19.
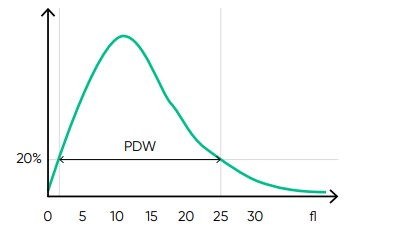
Fig 14. In Medonic M51, the normal platelet histogram shows a left-skewed distribution between 2 and 30 fL, with main part of the cells in the range of 2 to 15 fL. MPV is calculated as the sum of the size of all counted PLT pulses devided by the number of PLT pulses. PDW-SD is the geometric standard deviation of the average PLT size obtained by drawing anarbitrary line at a hight of 20% of the y-axis.
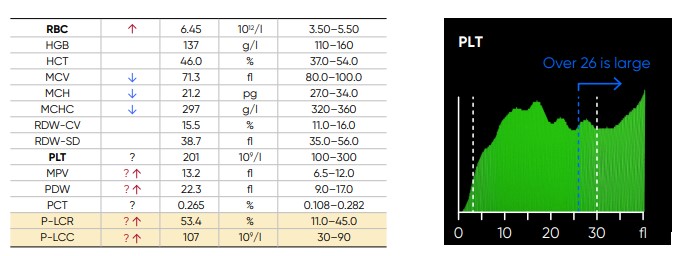
Fig 15. In Medonic M51, P-LCR is the counted PLT particles larger than 26 fL divided by the total counted PLT particles. The value is used to calculate P-LCC (= PLT × P-LCR). Interference with the P-LCR value can be due to the presence of PLT clumps, giant PLT, or microcytic RBCs in the sample.
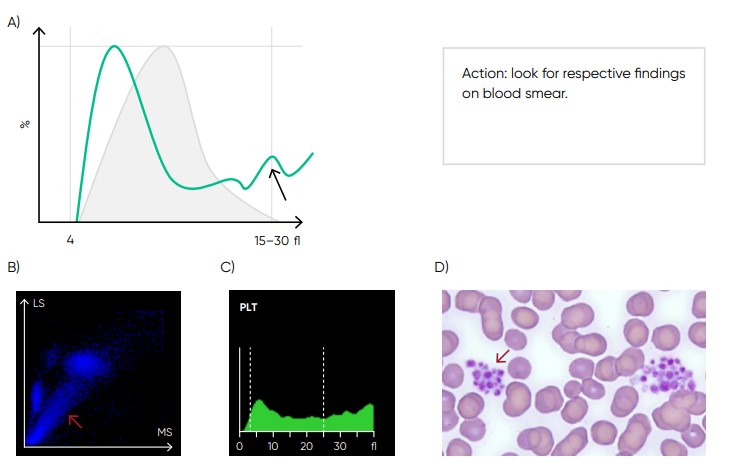
Fig 17. Possible causes of a PLT histogram showing an abnormal high at upper discriminator can be giant PLTs, PLT clumps, microcytic RBCs or RBC fragments. If PLT satellitism is observed on smear, this can be an indication of EDTA-incompatibility. Re-collect using citrate as anticoagulant and reanalyze the PLT count. (B) Medonic M51 scattergram with PLT aggregation (red arrow). (C) Medonic M51 histogram of PLT aggregation. (D) Microscope image of PLT aggregation (red arrow).
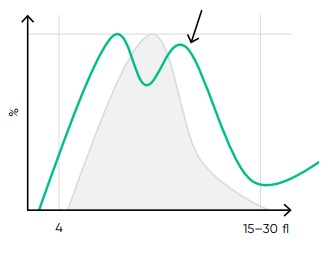
Fig 18. Multiple PLT peaks (dimorphic population) can be a reflection of recovery from chemotherapy, PLT clumping, or PLT anisocytosis, and can affect the PDW, P-LCR, or MPV values.
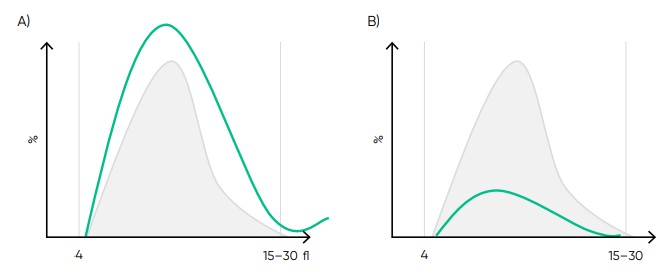
Fig 19. Effect of (A) thrombocytosis and (B) thrombocytopenia on the histogram.
The WBC scattergrams
The diameter of untreated cells of the WBC subpopulations ranges from 7 µm for the smaller LYM cells to
20 µm for the larger MON cells:
• Lymphocytes: 7–12 µm
• Basophils: 9–14 µm
• Neutrophils: 10–15 µm
• Eosinophils: 11–16 µm
• Monocytes: 12–20 µm
The cells of the WBC scattergram is shown in Figure 20. As the RBCs are lysed by the hemolytic reagent,
only PLTs and the WBCs are visible in the WBC channel. However, the small PLT particles (2–15 fL) do
not interfere with the results for the larger WBCs. Basophils are identified by volume and granularity in a
separate channel (Fig 21).
Examples of leucocyte abnormalities are shown in Figures 22 to 24.
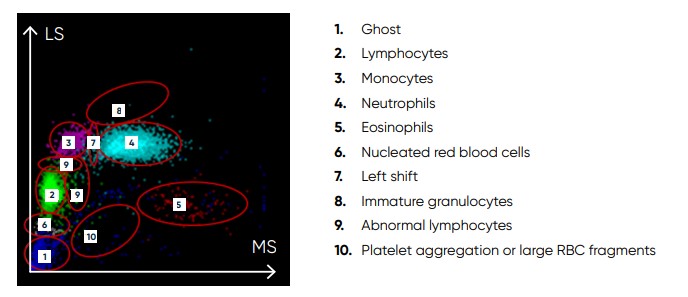
Fig 20. Scattergram from a normal sample, showing WBC subpopulations
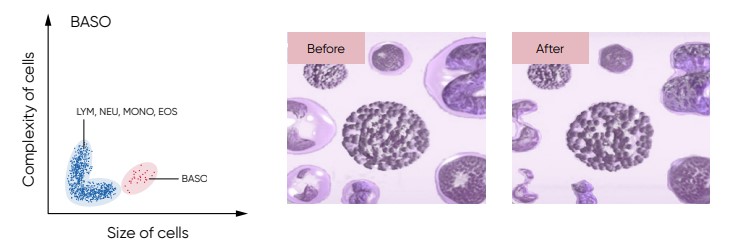
Fig 21. For the BAS count, the Medonic M51 Lyse 1 reagent contains a special hemolytic agent that is used to extract the BAS cells specifically, while preserving the cell information.
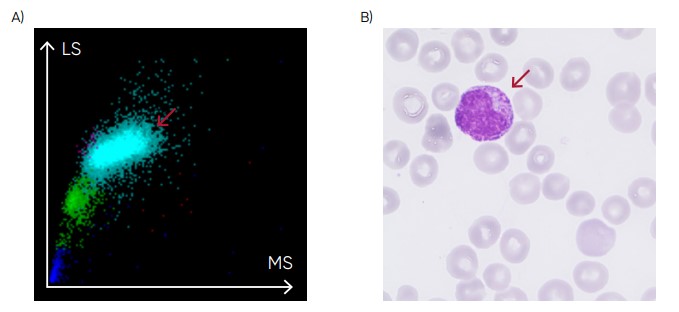
Fig 22. (A) Medonic M51 scattergram with presence of immature granulocytes. (B) Microscopic image of an immature granulocyte.
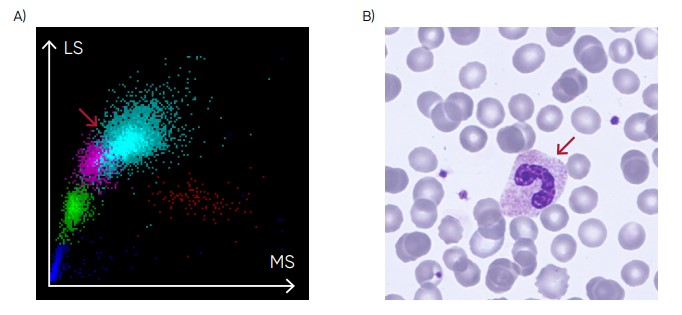
Fig 23. (A) Medonic M51 scattergram showing left shift (presence of band neutrophils). (B) Microscopic image of a band neutrophil.
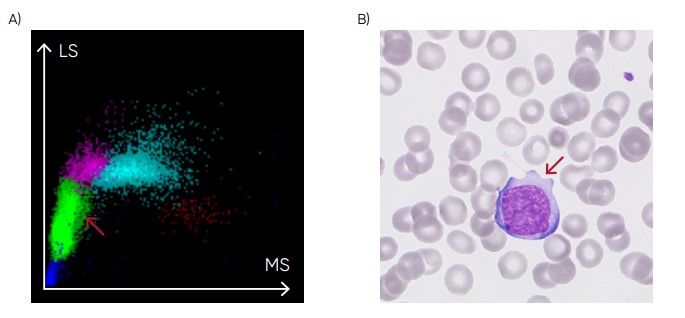
Fig 24. (A) Medonic M51 scattergram with presence of abnormal lymphocytes. (B) Microscopic image of an abnormal lymphocyte.
Conclusion
As the test is cost-efficient and simple to use, a complete blood count is widely requested, both as an initial test in patient assessments as well as in monitoring of disease progression and treatment efficacy. A modern hematology system reports a range of parameters as numerical data. As supplement, the analyzer visualizes the counted cells in histograms and scattergrams. Understanding the histograms and scattergrams will provide relevant information to support a suggested diagnosis before any further investigations are ordered.
Disclaimer
Medonic M51 from Boule Diagnostics is an automated hematology analyzer for in vitro diagnostic use under laboratory conditions. Boule products do not make diagnoses on patients. Boule intends its diagnostic products (systems, software, and hardware) to be used to collect data reflecting the patient’s hematological status. This data, in conjunction with other diagnostic information and the evaluation of the patient’s condition, can be used by a trained clinician to establish a patient’s diagnosis and to define clinical treatment.
Download Understanding histograms and scattergrams Medonic M51 as pdf