Veterinary hematology analyses: reference ranges
Veterinary hematology differs from human hematology, in that the hematopoietic cells differ between animals species and breeds. These differences include variation in cell composition, morphology and size, but also some species unique cell types such as heterophils in birds. For additional complexity, different species also show different response to stimuli and stress. All together, these variations pose challenges to veterinary hematology.
The importance of set reference ranges
As animals cannot speak and explain their symptoms, the blood count is important in investigations of underlying diseases. Automated hematology analyzers are frequently used in clinical laboratories to assess and monitor the health condition of patients.
Most automated hematology analyzers have pre-set reference ranges based on literature references or clinical studies. However, it is recommended that each clinic establishes its own reference ranges. When determining the reference values, the breeds, ages, and genders should be considered and also the source of the samples, as cell counts might vary between regions. Is also important to take into account that the normal range for an individual can be affected by factors such as medication, diet, stress, and pregnancy (2).
How is a result outside the reference values interpreted?
When a result is outside the reference range for the tested population, this is an indication of a possible clinical pathology. When this occurs, a manual microscopy is often performed to confirm the result and give additional information on for instance morphology.
As the reference range represents 95% of the “normal” of a population, 5% (or 1/20) samples will naturally fall outside of established range. As an example, if 20 analyses are performed on 100 “normal” animals of a certain population, only 36 of these animals would be considered “normal”. As an abnormal result should always be considered as clinically significant, the accuracy of the result should be challenged, especially if the results do not seem to match the clinical signs from the patient. A re-run of the test can give a good indication of a tentative diagnosis. The possibility of a sampling error (e.g., due to clotting or poorly mixed sample) should also be considered, as should external methodological or instrumental errors (e.g., expired reagents) (2).
Exigo™ H400 hematology analyzer
Exigo H400 supports unlimited number of profiles, which enables creating profiles for certain breeds of the same species, such as warm-blooded and cold-blooded horses, or for greyhounds and “other” dog breeds.
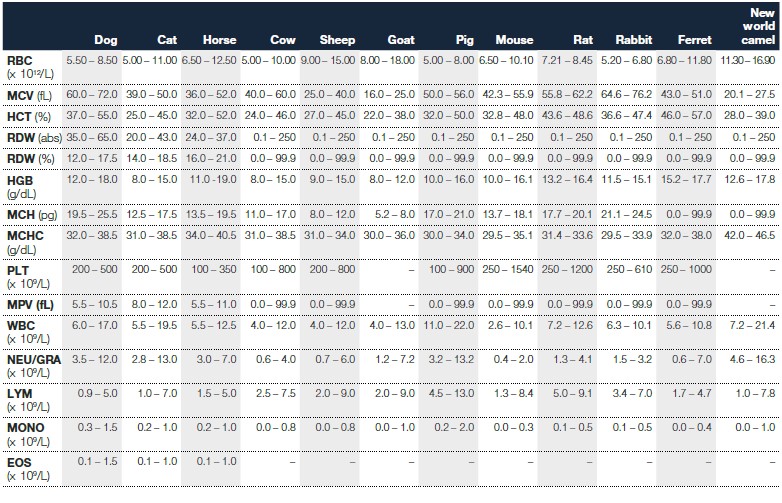
Table 1. Normal reference ranges provided with Exigo H400 for 12 pre-set species (1).
Physiological variations in white blood cell count
White blood cell count is one of the most important parameters of the complete blood count (CBC) and is used to identify immune system-related diseases. However, the patient’s physiological state should be considered when interpreting the results, as many factors can affect the WBC count (2):
• Age has a large impact on WBC. Young animals tend to have higher LYM and total WBC values than adults.
• Gender can sometimes affect the normal range for WBC. For instance, stallions have lower WBCs than mares of the same age.
• Breed is an important factor for variation. For example, the NEU count of greyhounds are lower compared to other breeds, and their EOS cells resemble banded NEU cells (Figure 1). Moreover, warm-blooded horses have a higher WBC count than cold-blooded horses.
• Physical exercise, acute stress, and excitation typically increase the WBC count (mainly related to an increase in NEU).
• Late pregnancy can many times increase the WBC count.
• Food intake can give significant increase in WBCs for dogs and swine around 1–2 h after a meal. However, in horses, the opposite occurs with a slight almost negligible decrease and in cattle there is no observed difference.
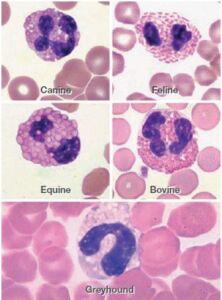
Fig 1. The eosinophil (EOS) appearance varies between (A) dogs, (B) cats, (C) horse, (D) cattle and (E) greyhounds.
Morphological changes of the immature neutrophils
The WBC are usually divided into five subpopulations: neutrophils (NEU), lymphocytes (LYM), monocytes (MONO), eosinophils (EOS) and basophils (BASO). However, it is not only the type of cell that is important, but also the lifetime stage morphology. Yet again we are back to a difficulty that hematology analyzers face. The five above named subpopulations can be identified but not specific morphological changes and stages in their maturation. Therefore, it is important that the instrument identifies and flags the sample as “abnormal”, so that a manual microscopy can be applied to verify the analyzers values as well as detect abnormalities in morphology.
Immature neutrophils
Neutrophils make up the largest segment of the WBCs (in general, some species excluded). They are produced in the bone marrow, where they then mature until they are released
into the blood stream as segmented neutrophils. However, occasionally immature neutrophils are also released into the circulation.
Immature neutrophils in circulation have a non-segmented nucleus compared to the mature NEU, which gives them a characteristic morphology and they are therefore known
as band neutrophils (Fig. 2). An increase in the immature neutrophils is depicted by the automated hematology analyzers as a left shift of the NEU peak in the histogram, why it also known as a “left-shift”. The left shift can be either degenerative or regenerative. In a degenerative left shift both the total NEU (neutrophilia) and band NEU counts are increased, this indicates a severe inflammation and is many times linked to an acute bacterial infection (sepsis). A regenerative left shift instead generally indicates an
increased ratio of immature to mature NEU regardless of the total WBC or NEU count. A regenerative left shift means that the bone marrow is responding to the physical needs, why it is generally not as severe as a degenerative left shift (2).
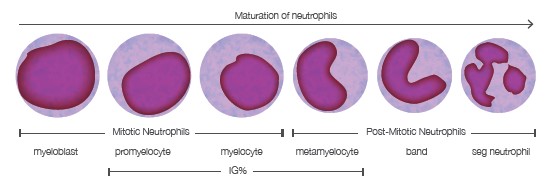
Fig 2. The maturation stages of segmented neutrophils.
Toxic changes
During and as a part of the inflammatory response, the immature neutrophils released from the bone marrow can have changes to their morphology, known as toxic changes, that identify them as immature. There are five main morphologies for toxic changes:
1. Toxic granulation
In the cytoplasm, red granules can easily be detected (due to granules taking up the stain well during the manual microscopy procedure). This change is less seen in small companion animals but quite common in larger animals such as horses, cattle, camels, etc. (3).
2. Döhle bodies
Döhle bodies are usually the first indication of a toxic change. As the rough endoplasmic reticulum (RER) come together in spirals, it cases blue aggregates that look quite linear. However, it is important to note that healthy cats can have a few small Döhle bodies. More importantly is to note that storage of blood can cause the formation of Döhle bodies from the neutrophils (3).
3. Cytoplasmic basophilia
Due to the rough endoplasmic reticulum (RER) and polyribosomes (translate mRNA into polypeptides) being scattered throughout the cytoplasm, the cytoplasm gets an irregular blue appearance. Depending on the number of NEU affected, the cytoplasmic basophilia can be classified as mild, moderate or severe (3).
4. Cytoplasmic vacuolation
Due to the degranulation of lysosomes (organelle in cells that breaks down molecules) in the cytoplasm, blurry vacuoles can be seen (important to note is that clear vacuoles are not a feature of a toxic change) (3).
5. Nuclear immaturity
Most difficult to detect in the microscope is the “nuclear immaturity”, where the chromatin in the nucleus is lighter and not as tightly packed as usual.
Toxic changes are usually pointing towards an inflammation and therefore many times is observed together with a left shift (with immature NEU). However, left shift without toxic changes can occur in animals, for example, immune-mediated hemolytic anemia in dogs. Although rare, a toxic change without a left shift is also sometimes observed, for example, in the case of marrow dysplasia (3).
WBC responses in different animal species
A phenomenon quite common among animals is a stress leukogram. This occurs when the animal is nervous, exited or scared, also known as the epinephrine-mediated response. Within a short time, the WBC population can shift dramatically and alter many parameters of the CBC analysis.
As the WBC response might differ between species, the stress leukogram, as well as inflammatory responses, also look different in between animals.
1. Dogs
In general, stress leukograms are not common in dogs, but both infections and stress can increase the NEU counts in dogs (typically to 10–30 × 109/L) and a significant left shift of about 1 × 10⁹/L band NEU is often seen in inflammation.
If a stress leukogram occurs in dogs, it tends to increase all different cell types (WBC, LYM, EOS, MON, NEU).
2. Cats
Unlike dogs, cats often give stress leukograms. This is usually shown by high LYM values (lymphocytosis) when it is induced by excitement. When stress is involved, it is usually indicated by a neutrophilia (high NEU) without a left shift and, in some cases, also by low EOS values (eosinopenia) and low LYM values (lymphopenia).
An inflammatory leukogram in cats is associated with WBC of 25–40 × 109/L, where more than 1 × 10⁹/L of band neutrophils signifies a substantial left shift.
3. Horses
The inflammatory leukogram of horses is less affected by large NEU increases as compared to dogs and cats. However, NEU counts of 10–20 × 109/L can be seen in infections, and banded NEU above 0.3 × 10⁹/L signifies a substantial left shift.
If the WBC is above normal, or sometimes within reference range, the left shift is regenerative. Temporary neutropenia might instead indicate a serious condition and in such a case, the number of banded NEU are usually almost the same as the segmented NEU, together with a low WBC count.
A stress leukogram can also be seen in horses during hard exercise and excitement. Here, the stress leukogram is usually indicated by an increase in WBC to 12–15 × 109/L, without a left shift and with a normal to low LYM count.
4. Swine
The WBC for swine is usually high. During infection, however, a large increase in the NEU (typically 25–35 × 109/L) can be observed.
5. Cattle
Cows are slightly different than other ruminant animals and mammals in that their peripheral blood usually have more LYM than NEU. A WBC between 15–25 × 109/L is considered a significant leukocytosis and above 25 × 109/L it is severe.
In case of inflammation, LYM is decreased and NEU is either decreased or slightly increased, the total WBC count is usually within the normal range or even lower than normal. Usually, a significant left shift (> 0.3 × 10⁹/L band NEU) is observed.
On the other hand, in chronic inflammations, the WBC can be as high as 20 × 109/L and accompanied by a neutrophilia and a left shift of more than 0.3 × 10⁹/L band NEU. To aid in diagnosis, the fibrinogen count in cow serum can be an additional marker for inflammation.
The stress leukogram for cows tends to be associated with WBC of 8–18 × 109/L, without left shift and with lymphopenia and eosinopenia. Excitement and an epinephrine-mediated response, on the other hand, can give WBC counts of 15–27 × 109/L, without a left shift and LYM, EOS and MONO values within their normal ranges.
Examples of other parameters also affected by physiological variations
It is not only the WBCs that can be affected by physiological variations. Many other parameters of the CBC can also be affected.
For instance, for red blood cells (RBCs), the hemoglobin value (HGB) and the hematocrit (HCT) levels can be affected by anxiety, stress and activity in animals. One example is spleen contractions, that can stimulate the release of RBCs into the blood vessels, increasing the red blood cell count. This phenomenon is particularly prominent among horses, in which the HCT can increase up to 40%. Especially for warm-blooded horses who have a spleen that acts as a large storage for the RBCs, giving a much wider normal reference range for HCT, HGB and RBC. All these three red cell parameters are also affected by age, late pregnancy, malnutrition, etc.
Another example is thrombocytopenia, which in general indicates a bleeding or a defect platelet production. But for the dog breed Cavalier King Charles spaniels, macrocytic thrombocytopenia can actually be a normal state. Macrocytic platelets can also be erroneously counted as RBCs by automated hematology systems, and therefor can give an increase in the RBC peak, which should be taken in to account when analyzing blood from this breed of dog.
Conclusion
Veterinary hematology is challenged by both inter- and intraspecies variations. To interpret a CBC, it is important to know the normal reference range for the specific population to be tested. Conditions such as stress or excitement might also affect the parameter values. With Boule’s Exigo H400 analyzer, normal reference ranges are pre-set for 12 animal profiles. By addition of more profiles, reference ranges should be checked with local reference labs or university labs or possibly literature values.
References
(1) Nemi C. Jain. Essentials of Veterinary Hematology. Lea & Febiger, Philadelphia, 1993.
(2) Gröndahl, G. Veterinary Hematology – An introduction. Boule Diagnostics, 33267, Edition 4 (2019).
(3) eClinpath, http://eclinpath.com (2013)
PDF download
White paper: White paper normal reference ranges