Automated hematology analysis: understanding histograms
Hematology analysis is a cost-efficient tool that provides useful information to clinical assessments. A complete blood count (CBC) is often requested in initial disease investigation, as the results form the basis for decision-making regarding further testing, diagnosis, and treatment. A CBC test can give an indication of a variety of diseases and conditions that affect the blood cells, such as anemia, infection, or leukemia. This paper aims to provide an understanding of the cell count results visualized in histograms by an automated hematology analyzer.
Introduction
Through a process called hematopoiesis, blood cells are derived from pluripotent hematopoietic stem cells in the bone marrow, where they mature before being released into circulation (Fig 1). In healthy adults, about one trillion (1012) new blood cells are produced every day. The release of mature cells into the circulation and their migration to various tissues are the result of organs communicating through the endocrine signaling system. The presence of immature cells in the bloodstream can therefore be an indication of a bone marrow failure. Additionally, many factors can make normal cells appear abnormal, including inflammation and infection, and abnormal cells can change back to normal if the underlying cause is removed or resolved.
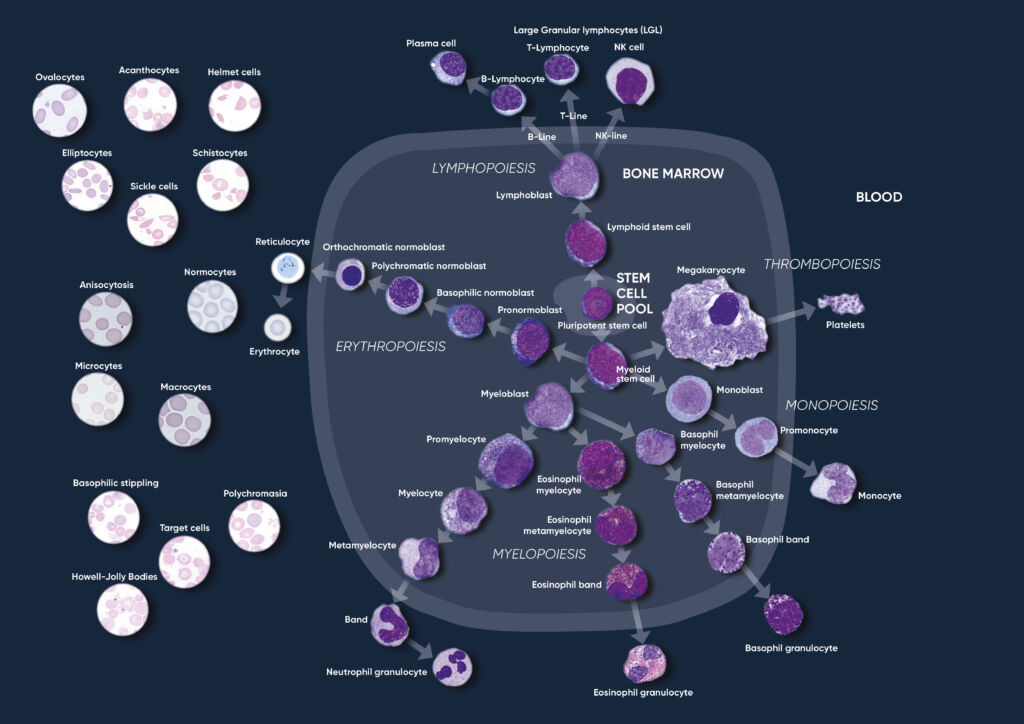
Fig 1. Overview of the hematopoietic blood cell production process (image created by Sigward Söderström and Helene Johansson, Örebro University Hospital, Sweden), which is growth factor-dependent and strictly regulated to maintain steady-state blood levels. Abnormally high or low levels are associated with different types of disease conditions.
A CBC test evaluates the cells in circulation, including the oxygen-carrying red blood cells (RBC), the platelets (PLT) that help clot the blood, and the white blood cells (WBC) of the immune system. The cell count reflects the specific need for the different cell populations at a specific timepoint.
Hemoglobin-rich erythrocytes are the most common blood cells (normal range ~ 4–6 × 10¹²/L). Their main function is to carry inhaled oxygen from the lungs to the tissues and organs of the body and remove carbon dioxide that is carried back to the lungs and exhaled.
The primary function of platelets (normal range ~ 130–400 × 109 /L) is to prevent bleeding. They interact with each other and other cells such as the WBCs and vascular endothelial cells to search for sites of injury, where they become activated.
As part of the CBC, a WBC differential count is often conducted. In normal blood, about 50%–70% of the WBCs are neutrophil (NEU) cells. NEUs help fight bacteria (and fungi), and a high count is often associated with a bacterial infection. Lymphocyte (LYM) cells, accounting for about 20%–30% of all WBCs, help fight viruses. A high LYM count can therefore be an indication of a viral infection. The last 10% comprises monocyte (MON), eosinophil (EOS), and basophil (BAS) cells. These cell types are typically associated with allergies and parasite infections. A high MON number (2%–8% normal), for example, can indicate a chronic inflammatory disease, whereas a high EOS count (1%–4% normal) can be an indication of asthma, an allergic reaction, or a parasite infection. A high BAS number (< 1% normal) is typically associated with an inflammatory reaction, especially such that causes allergic symptoms. High numbers of the WBCs can also be an indication of certain forms of cancers, such as leukemia or lymphoma.
In addition to reporting the blood cell counts, an automated hematology analyzer determines a range of other parameters, such as hemoglobin (HGB) content; parameters related to cell size such as the mean corpuscle volume (MCV), mean PLT volume (MPV), RBC distribution width (RDW), and PLT distribution width (PDW); as well as calculated parameters such as the mean red cell hemoglobin (MCH = HGB/RBC), mean red cell hemoglobin concentration (MCHC = HGB/HCT), hematocrit (HCT = RBC × MCV), and plateletcrit (PCT = PLT × MPV).
Automated hematology analysis results
The cell counts are performed in parallel cycles on the automated hematology analyzer (Fig 2). A dilution reagent provides an isotonic environment for the RBC and PLT counts, while a hemolytic reagent lyses the RBCs to release HGB and shrinks the WBCs to allow differentiation of these cells into their subgroups. The results are presented as parameter values as well as in histograms, which are graphical representations of the numerical data of the different cell populations.
Histograms provide information about the average volume of RBC, PLT, and WBC cell populations, size distribution of the cell populations, and detection of subpopulations. The x-axis represents the volume of the cells in femtoliters (fL), whereas the y-axis represents their relative occurrence (number of cells) in percent (Fig 3).
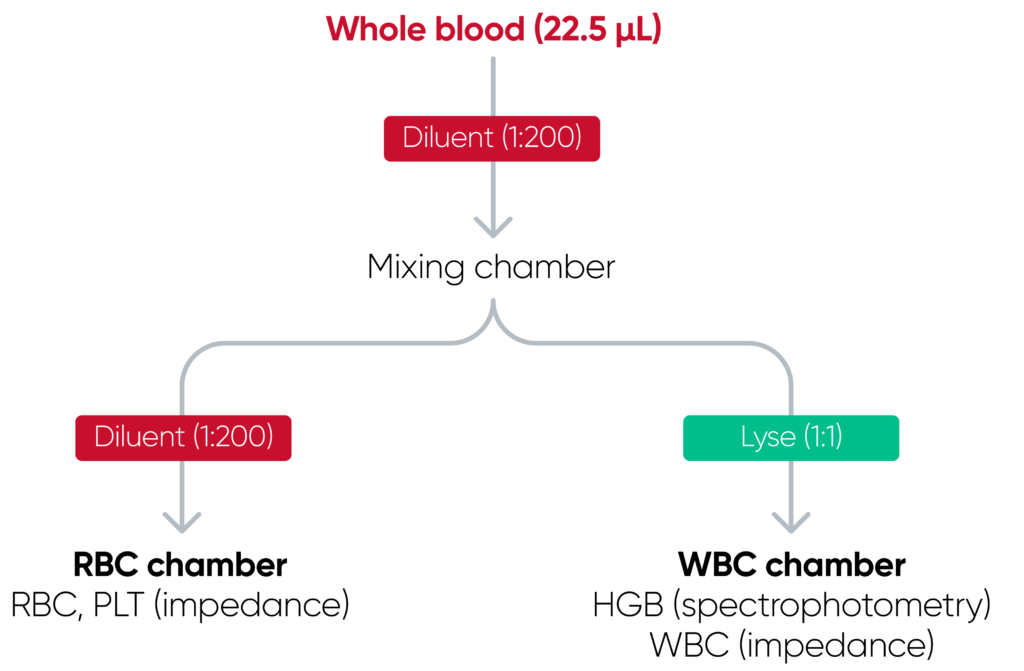
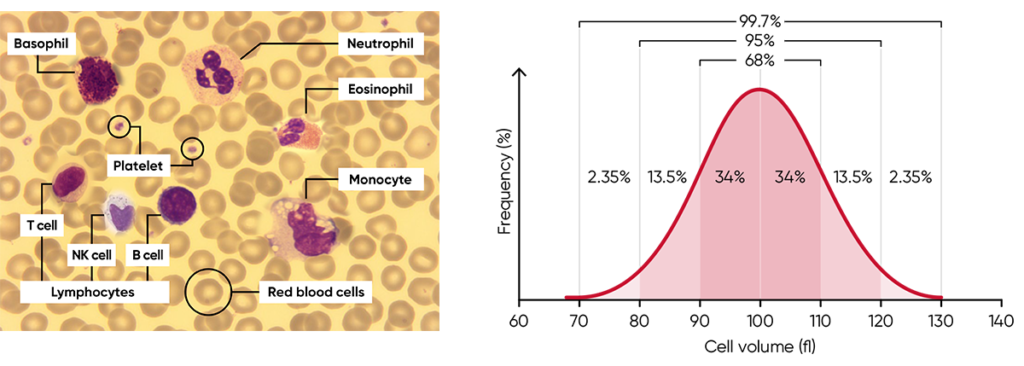
Fig 3. (A) Giemsa-stained blood cells photographed at 1000× magnification using a light microscope. (B) Cell variation in size within an individual population is called intra-individual biological variation. This variability has certain limits and is called Gaussian (or normal) distribution.
The histograms constitute an important part of the results and should be carefully studied, as they provide valuable and important insights about the sample processed by the analyzer (Fig 4). A normal histogram starts and ends on the baseline.
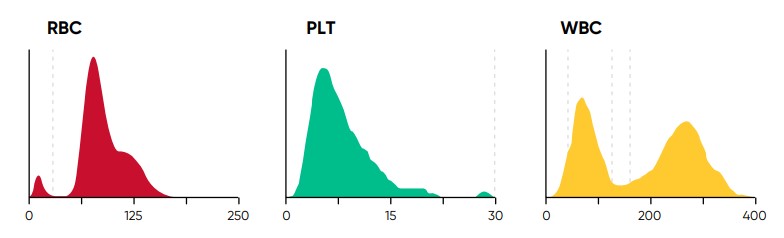
Fig 4. In Swelab Alfa Plus, PLTs and RBCs are counted between fixed discriminators at 4 and 250 fL. Using a floating discriminator between 15 and 30 fL, the Swelab Alfa Plus analyzer prevents microcytic RBCs to be falsely counted as PLTs and elevated PLTs to interfere with the RBC count by finding the minima between PLT and RBC histograms. WBCs are counted between 45 and 600 fL.
The RBC histogram
From the RBC histogram, the MCV and RDW values are calculated from the area under the curve (Fig 5). MCV is the average RBC volume, while RDW provides information about the degree of variation in RBC size (Fig 6). Examples of erytrocyte abnormalities are shown in Figures 7 to 11.
Correct treatment of the blood sample prior to analysis is vital for the accuracy of the results. The blood sample must be less than eight hours old in order to obtain a correct WBC differential (Fig 12). The results are also affected if the sample is not allowed to rest for 15 min after drawing.
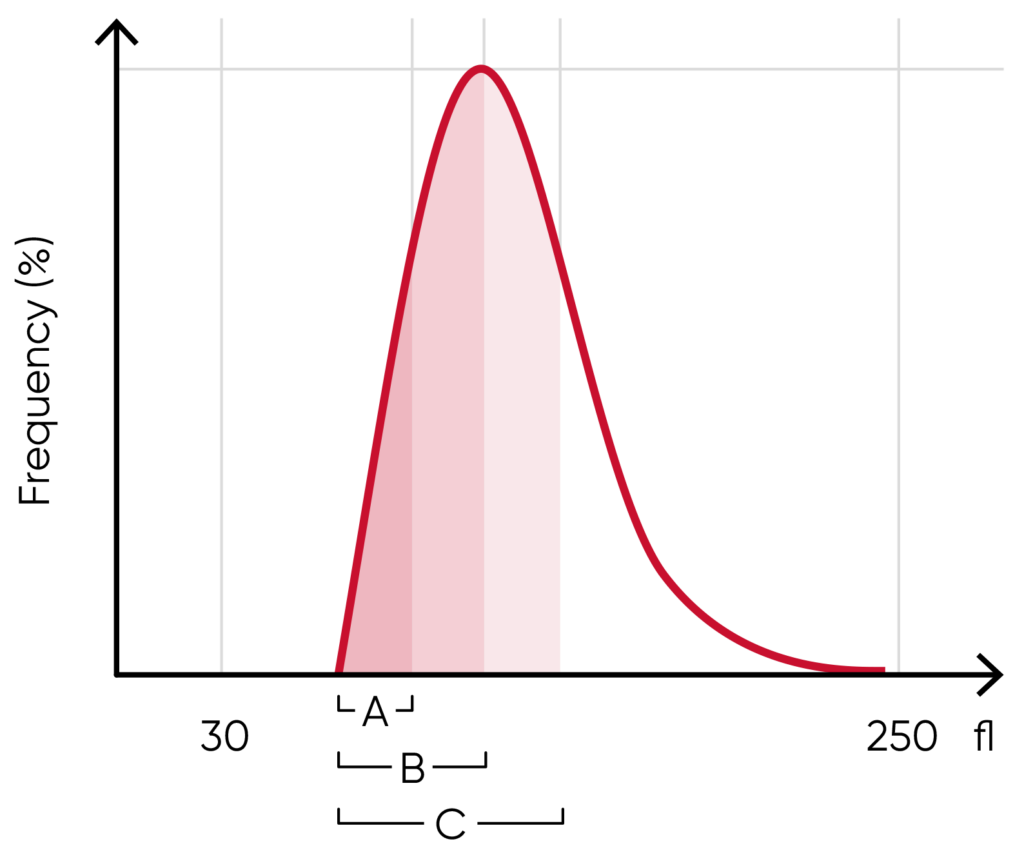
Fig 5. In Swelab Alfa Plus, MCV is calculated as the sum of the size of all counted RBC pulses devided by the number of RBC pulses, RDW absolute value in fL (RDWa) is calculated as f(BAUC – AAUC), and RDW% is calculated as f((CAUC – AAUC)/BAUC), where f is the normalization factor.
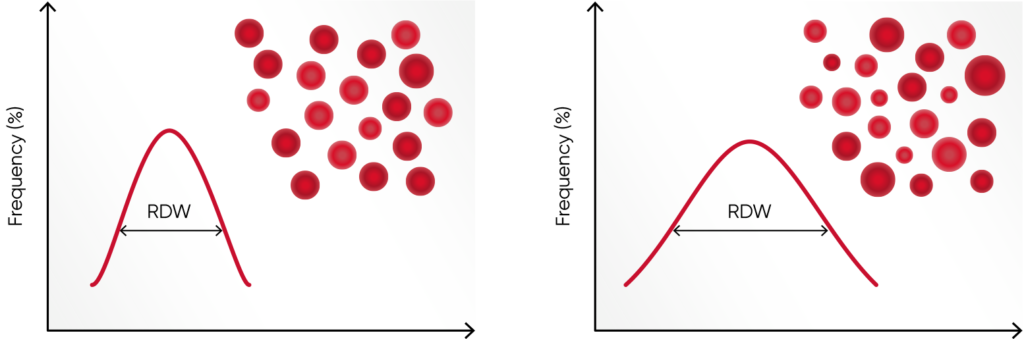
Fig 6. (A) Moderate anisocytosis (RDW 11%–20%). (B) Pronounced anisocytosis (RDW > 20%).
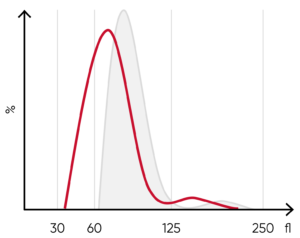
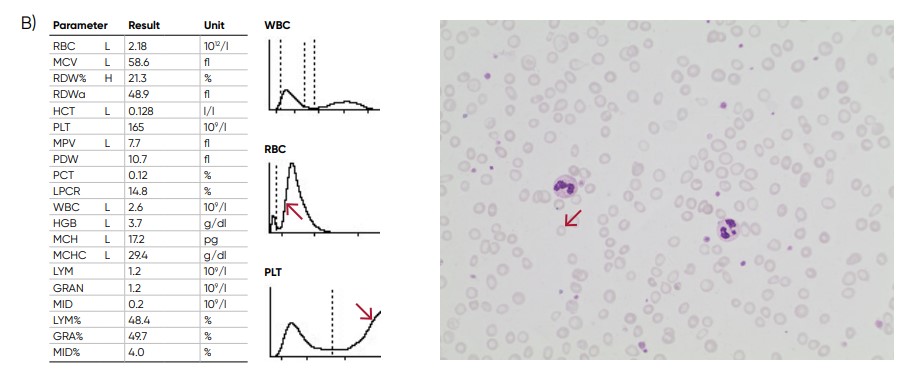
Fig 7. (A) A shift of the RBC histogram to the left gives an indication of microcytic RBCs (smaller than normal).
(B) Sample results of iron-deficiency anemia, showing microcytosis (red arrow), anisocytosis, and hypochromasia.
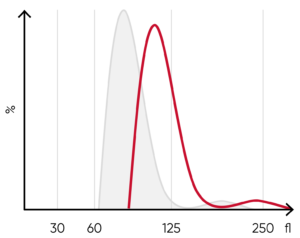
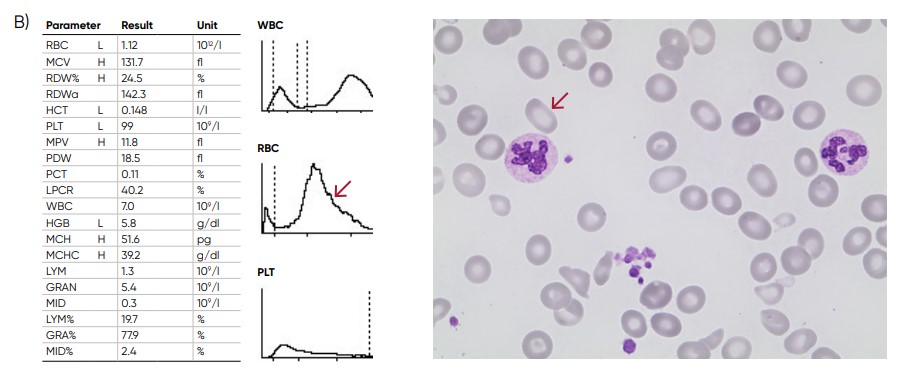
Fig 8. (A) A shift of the RBC histogram to the right gives an indication of macrocytic RBCs (larger than normal).
(B) Sample results of vitamin B12 (folic acid)-deficiency anemia, showing macrocytosis (red arrow) and anisocytosis.
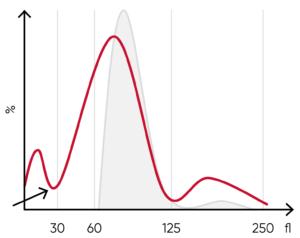
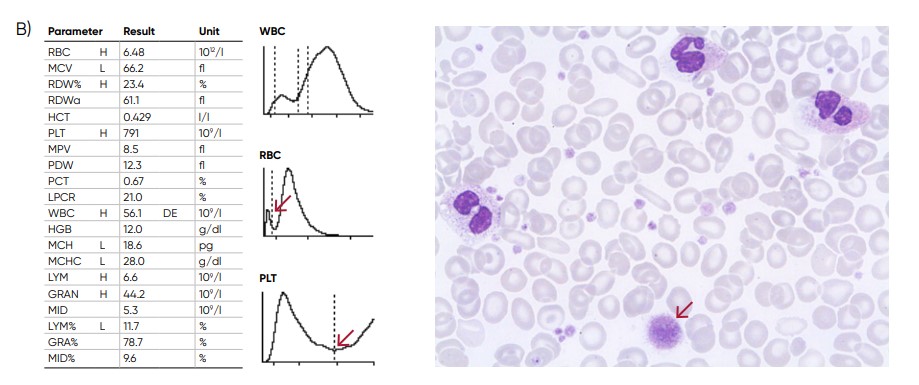
Fig 9. (A) Possible causes of an RBC histogram showing an abnormal high at the lower discriminator can be RBC or WBC
fragments, large (giant) PLTs, microcytic RBC, or PLT clumps. (B) Sample results of chronic myeloproliferative disorder,
showing several RBC abnormalties (pencil cells, helmet cells, acanthocytes, hypochromasia, and teardrop cells) and
several giant platelets (red arrow).
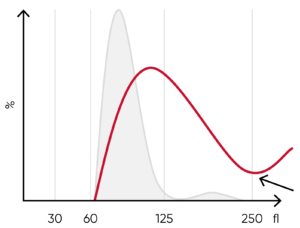
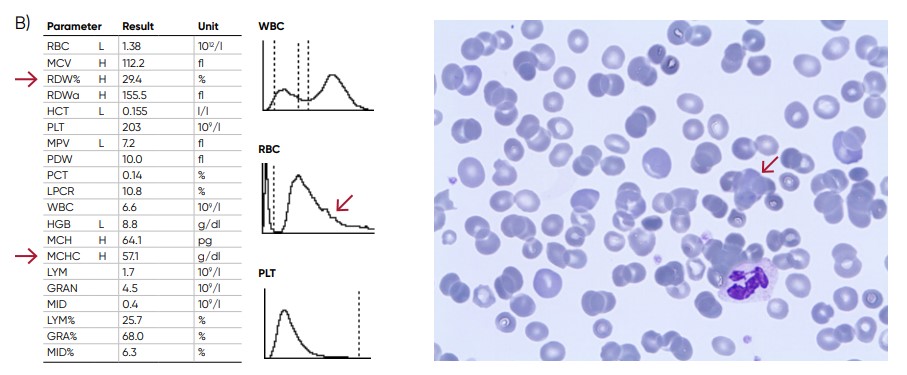
Fig 10. (A) Possible causes of an RBC histogram showing an abnormal high at the upper discriminator can be RBC
agglutination, cold agglutination, nucleated RBCs, or small LYMs, for example, due to chronic lymphocytic leukemia
(CLL). Rule out cold agglutination by warming the sample at 37˚C for 15 min and reanalyze. (B) Sample results of cold
agglutination (red arrow), with microscope image showing RBC clumping due to cold storage of the sample.
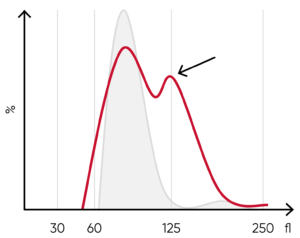
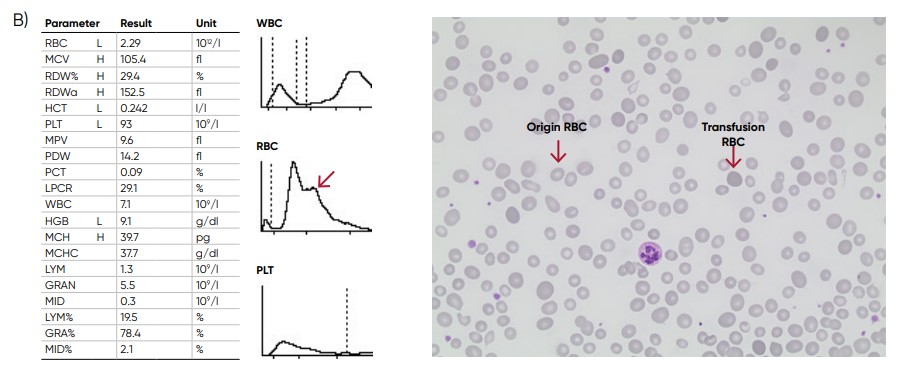
Fig 11. (A) Multiple RBC peaks can be a reflection of iron deficiency in recovery, dual-deficiency anemia (iron and
vitamin B12/folic acid), or blood transfusion. (B) Sample results showing dual RBC size (red arrow) after a transfusion.
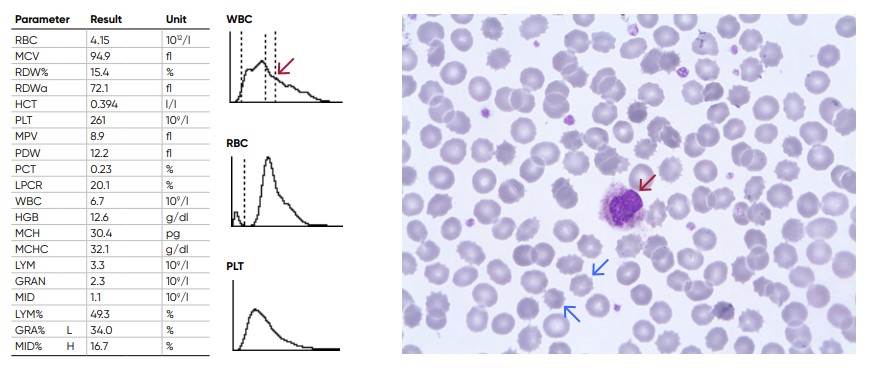
Fig 12. Old sample showing spiny RBCs (blue arrows) and an increase in the proportion of the cells in the MID-region due
to shrivelled neutrophils (red arrow)
The PLT histogram
From the PLT histogram, the MPV and PDW values are calculated from the area under the curve (Fig 13). MPV is the average PLT volume, while PDW provides information on the degree of variation in PLT size. The PLT large cell ratio (P-LCR) is the amount of PLT particles larger than 12 fL in relation to the total number of PLT particles, and this value is used to calculate the PLT large cell concentration (P-LCC) (Fig 14). Examples of thrombocyte abnormalities are shown in Figures 15 to 19.
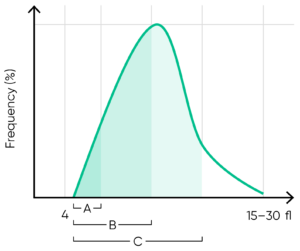
Fig 13. In Swelab Alfa Plus, MPV is calculated as the sum of the size of all counted PLT pulses devided by the number of PLT pulses, PDW absolute value in fL (PDWa) is calculated as f(BAUC – AAUC), and PDW% is calculated as f((CAUC – AAUC)/BAUC), where f is the normalization factor.
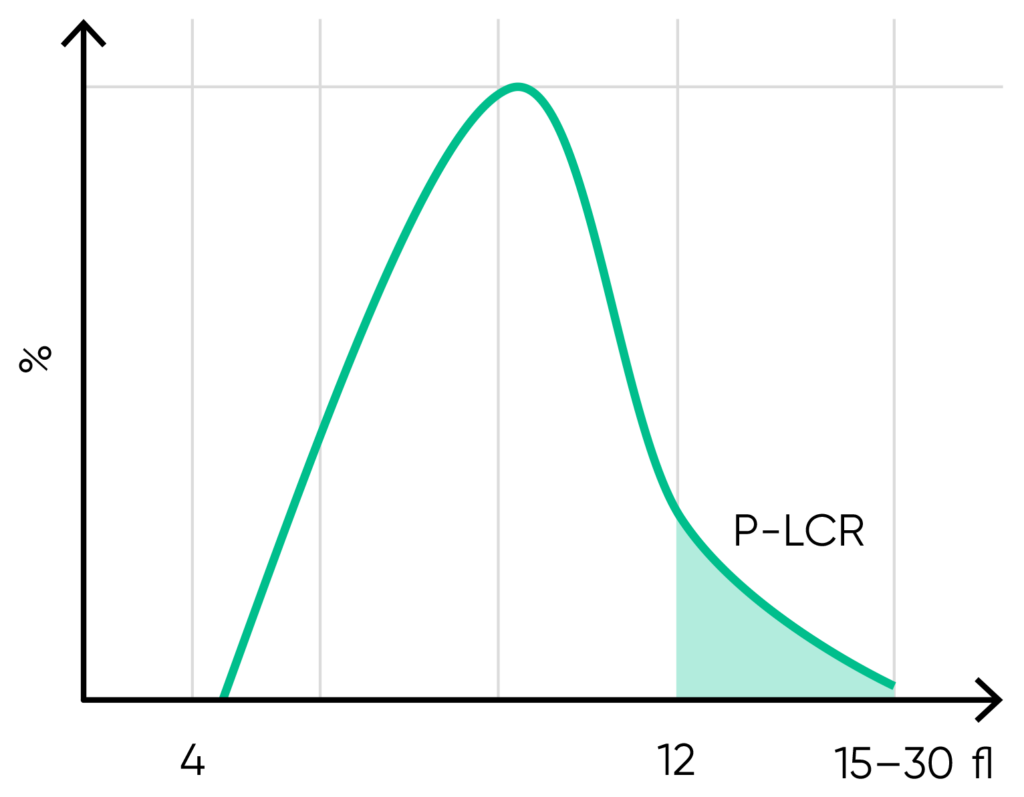
Fig 14. P-LCR is the counted PLT particles larger than 12 fL divided by the total counted PLT particles. The value is used to calculate P-LCC (= PLT × P-LCR). Interference with the P-LCR value can be due to the presence of PLT clumps, giant PLT, or microcytic RBCs in the sample.
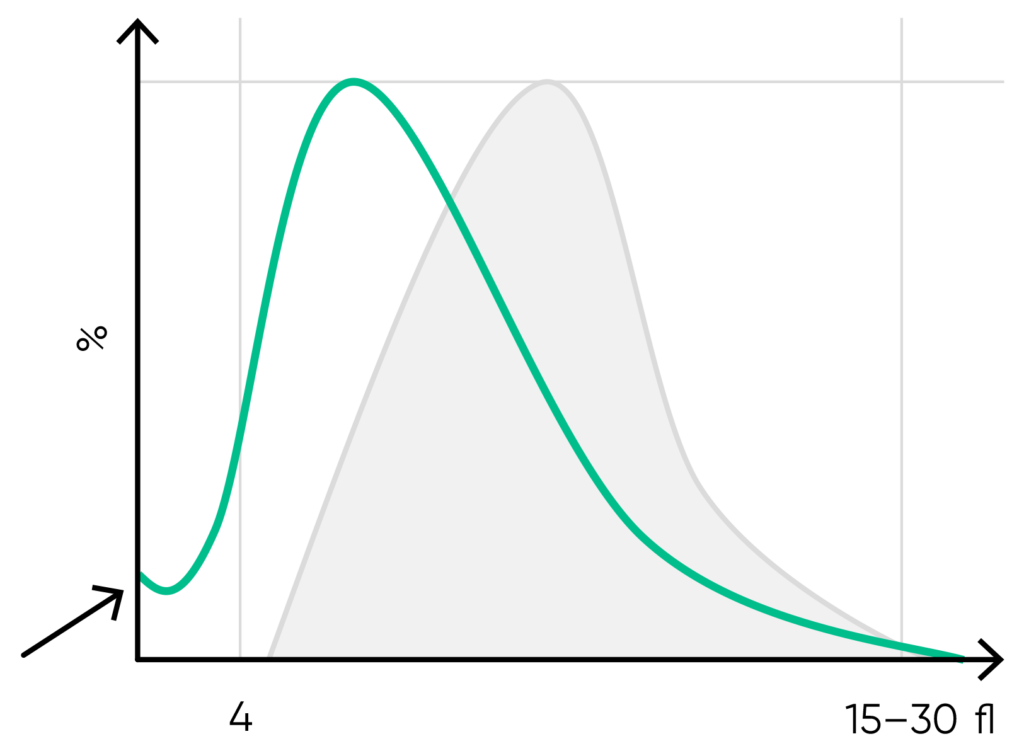
Fig 15. Possible causes of a PLT histogram showing an abnormal high at the lower discriminator can be a high background count, PLT aggregation, RBC fragments, or a bacterial contamination of the reagent. Action: check background count, run auto-rinse if required, and reanalyze the sample. Look for respective findings on blood smear. If this abnormality happens in many samples, check reagent for contamination. If the abnormality is due to PLT aggregation, an abnormal high at the upper discriminator is also shown.
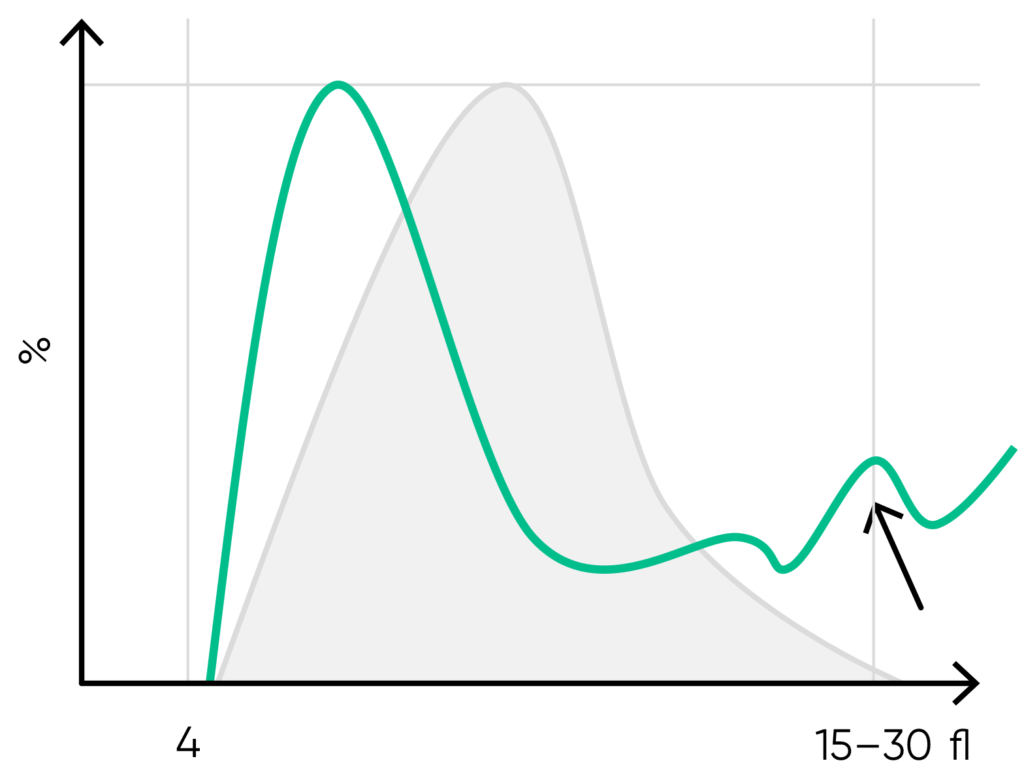
Fig 16. Possible causes of a PLT histogram showing an abnormal high at the upper discriminator can be giant PLTs, PLT clumps, microcytic RBCs or RBC fragments. Action: look for respective findings on blood smear. If PLT satellitism is observed on smear, this can be an indication of EDTA-incompatibility. Re-collect using citrate as anticoagulant and reanalyze the PLT count.
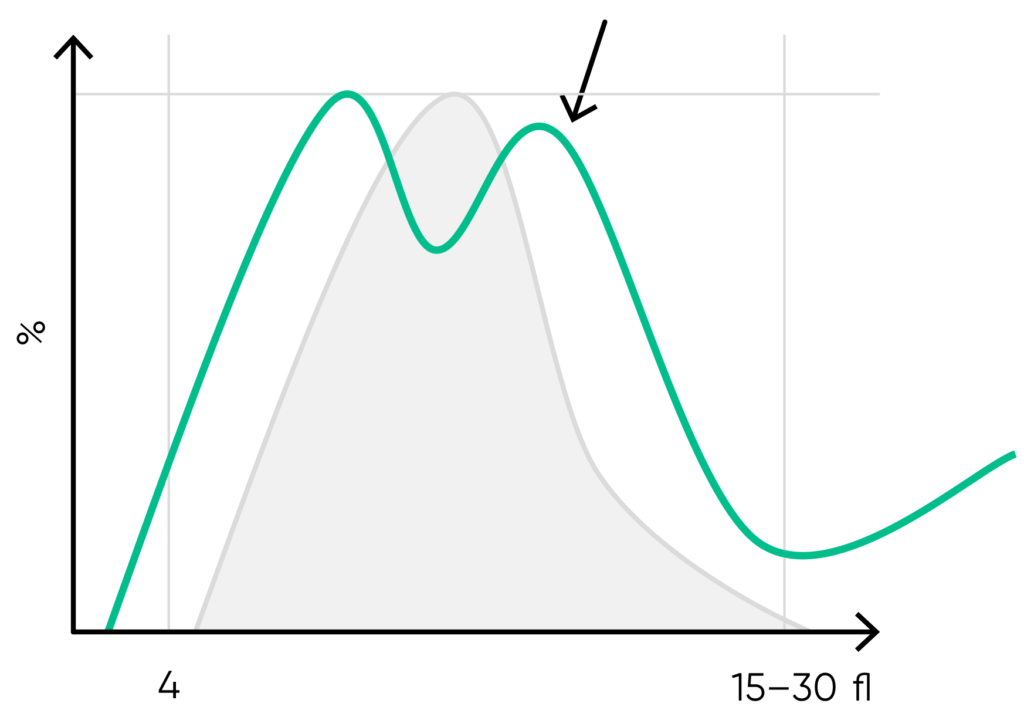
Fig 17. Multiple PLT peaks (dimorphic population) can be a reflection of recovery from chemotherapy, PLT clumping, or PLT anisocytosis, and can affect the the PDW, P-LCR, or MPV values.
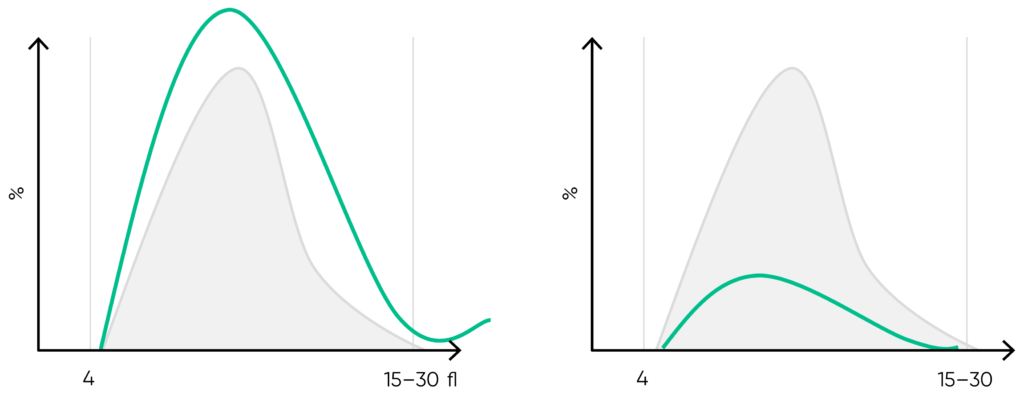
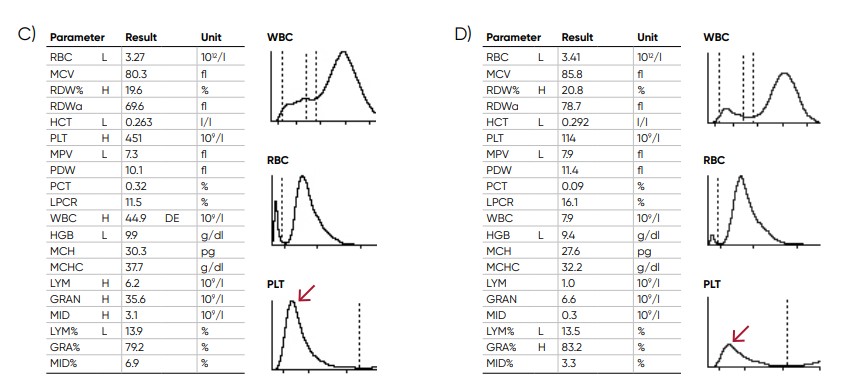
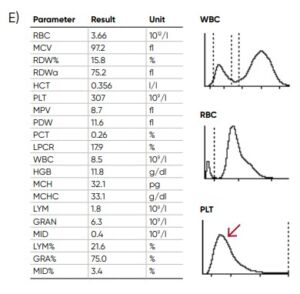
Fig 18. Effect of (A) thrombocytosis and (B) thrombocytopenia on the histogram. Results from (C) thrombocytotic and (D) thrombocytopenic samples compared with (E) a normal sample.
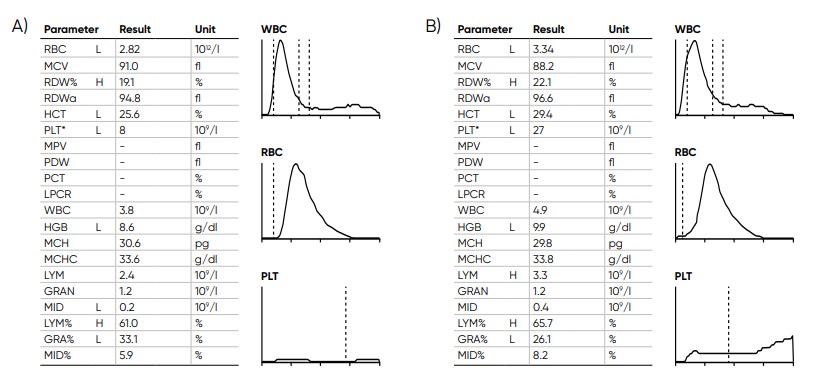
Fig 19. Samples with low PLT count (A) without irregular PLT distribution versus (B) with irregular PLT distribution, Swelab Alfa Plus gives a FD flag (irregular distribution) when it is not possible to find the correct position for the floating RBC/PLT discriminator at low PLT counts. The asterisk (*) at the PLT parameter indicates that the extended PLT count functionality of Swelab Alfa Plus was used. Action: confirm by microscopic examination.
The WBC histograms
Before being treated with hemolytic reagent, the cell diameter of the WBC subpopulations ranges from 7 µm for the smaller LYM cells to 20 µm for the larger MON cells:
• Lymphocytes: 7–12 µm
• Basophils: 9–14 µm
• Neutrophils: 10–15 µm
• Eosinophils: 11–16 µm
• Monocytes: 12–20 µm
The lyse reagent shrinks the cells to a defined volume for each cell type (Fig 20).
As the RBCs are lysed by the hemolytic reagent, only PLTs and the WBCs are visible in the WBC channel.
However, the small PLT particles (8–12 fL) do not interfere with the results for the larger WBCs (Fig 21).
Examples of leucocyte abnormalities are shown in Figures 22 to 27.
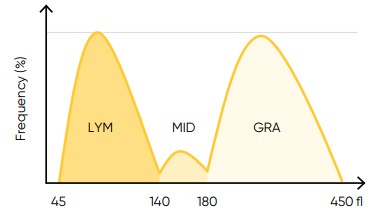
Fig 20. In Swelab Alfa Plus, the LYM region is defined as cells between 45 and 140 fL, the MID region (MON) is defined as cells between 140 and 180 fL, and the GRA region (NEU, EOS, BAS) is defined as cells between 180 to 450 fL
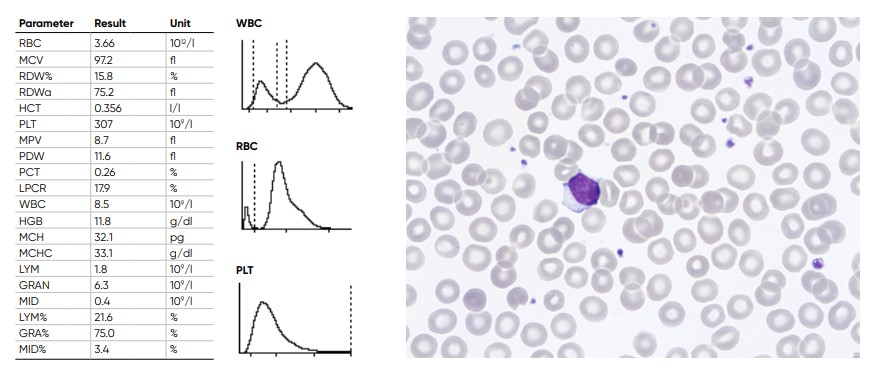
Fig 21. Results from normal samples, with histograms for PLT, RBC, and WBC showing the subpopulations LYM, MID, and
GRA cells.
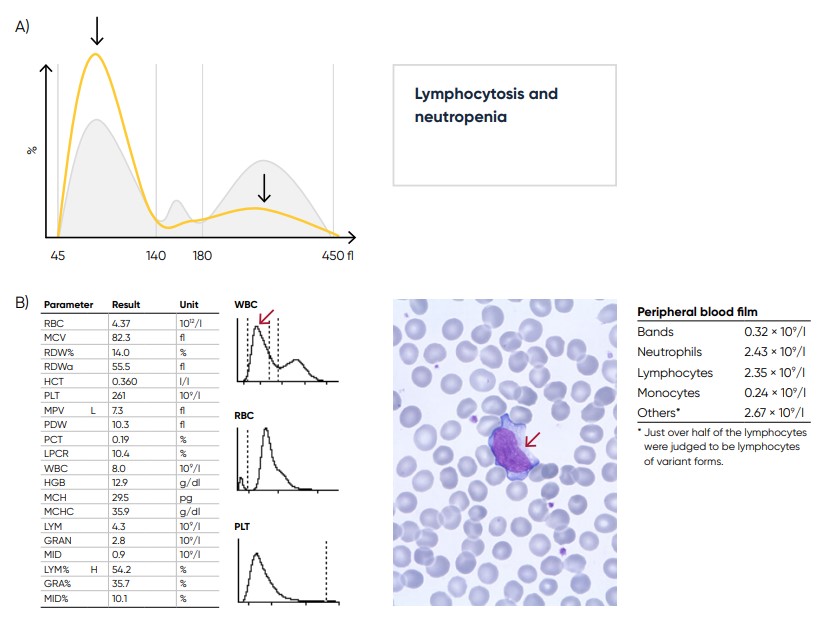
Fig 22. (A) Sample results in case of lymphocytosis and neutropenia, which can be caused by a viral infection.
(B) Sample results showing variant lymphocytes (red arrow) caused by tonsillitis mononucleosis.
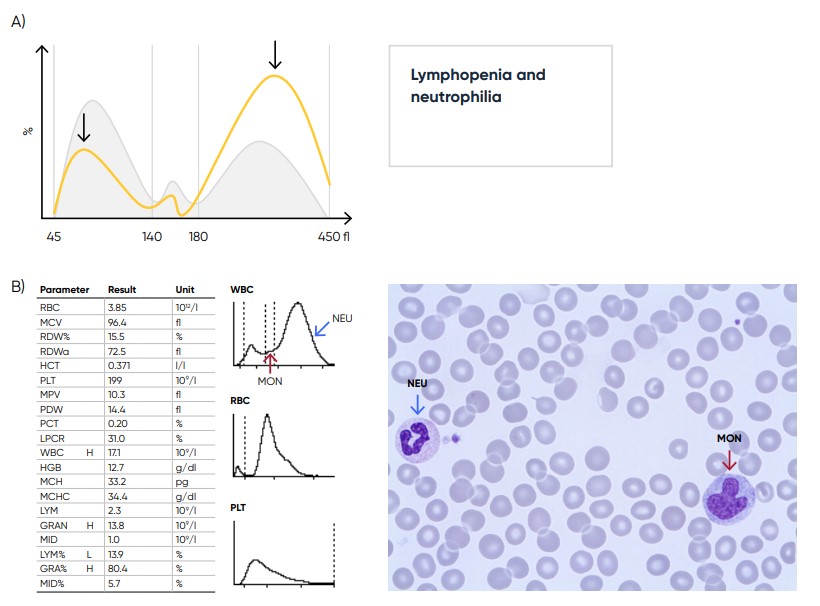
Fig 23. (A) Sample results in case of lymphopenia and neutrophilia, which can be caused by a bacterial infection.
(B) Sample results showing neutrophilia (red arrow) and monocytosis (blue arrow) due to sepsis with E. coli.
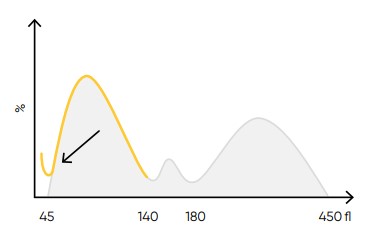
Fig 24. Possible causes of a WBC histogram showing an abnormal high at the lower discriminator can be PLT clumps, giant PLT, nucleated RBCs, lyse-resistant RBCs, or cryoglobulins.
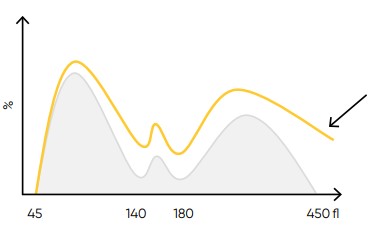
Fig 25. Possible causes of a WBC histogram showing an abnormal high at the upper discriminator can be severe neutrophilia or
extreme leucocytosis (> 100 × 109 cells/L). Action: dilute sample, reanalyze WBC differential count, and check by manual microscopy.
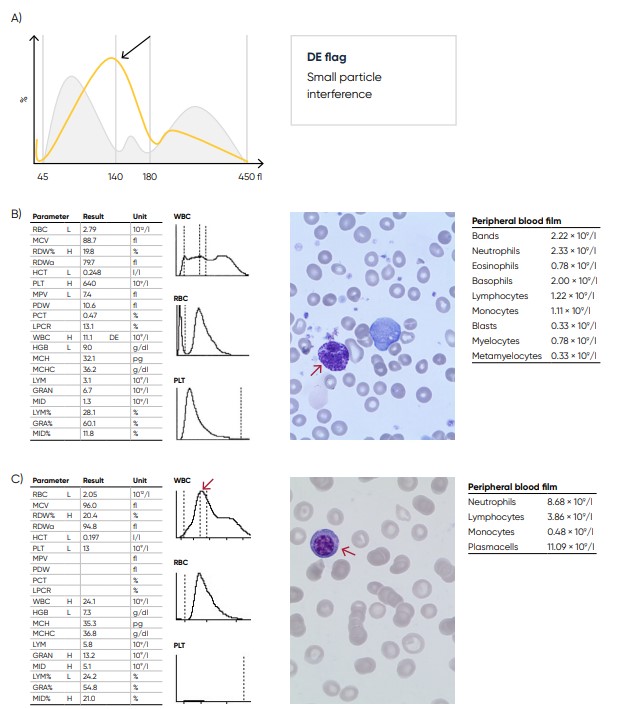
Fig 26. (A) Possible causes of a WBC population with no plateau found at the discriminator can be the presence of blast cells, eosinophilia, basophilia, plasma cells, or abnormal/variant LYMs. Action: blood smear analysis is recommended (B) Sample results showing basophilia (red arrow) caused by chronic myelogenous leukemia (CML). (C) Sample results showing plasma cell (red arrow) leukemia.
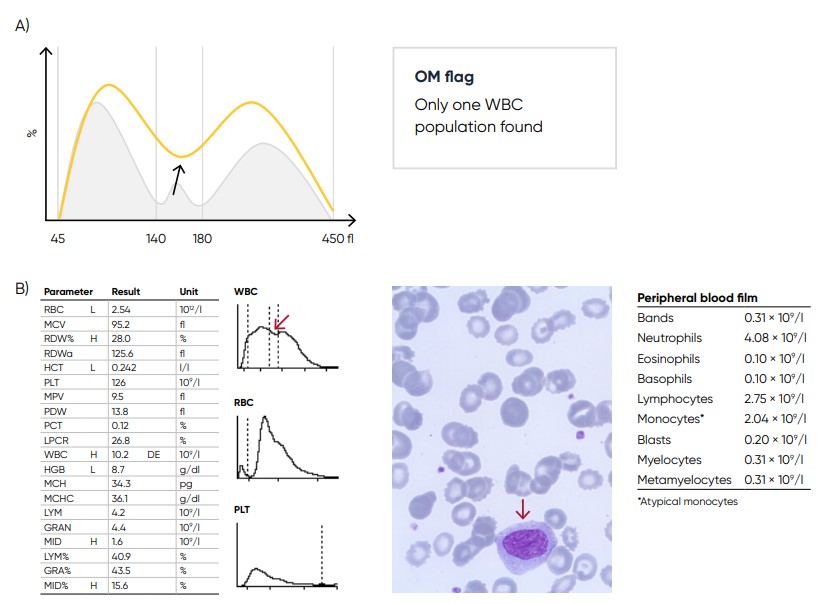
Fig 27. (A) Possible causes of a WBC with values far from base line can be monocytosis, eosinophilia, or basophilia.
Action: blood smear analysis is recommended. (B) Sample results showing monocytosis (red arrow) due to acute myeloid
leukemia (AML) with myelocyte maturation
Conclusion
As the test is cost-efficient and simple to use, a complete blood count is widely requested, both as an initial test in patient assessments as well as in monitoring of disease progression and treatment efficacy. A modern hematology system reports a range of parameters as numerical data. As supplement, the analyzer provides histograms that visualize the counted cells in size distribution curves. Understanding the histograms will provide relevant information to support a suggested diagnosis before further investigations are ordered.
Disclaimer
Swelab Alfa Plus from Boule Diagnostics is an automated hematology analyzer for in vitro diagnostic use under laboratory conditions. Boule products do not make diagnoses on patients. Boule intends its diagnostic products (systems, software, and hardware) to be used to collect data reflecting the patient’s hematological status. This data, in conjunction with other diagnostic information and the evaluation of the patient’s condition, can be used by a trained clinician to establish a patient’s diagnosis and to define clinical treatment.
Acknowledgement
We thank Kristina Nilsson, Reg. Biomedical Scientist, and Sigward Söderström, Reg. Biomedical Scientist, for collecting, editing, and photographing material for the case studies. All material for these investigations had been taken from daily routine blood samples analyzed in the Hematology Laboratory, at the Department of Clinical Chemistry, Örebro University Hospital, Sweden. We also thank Maria Åström,
Hematologist, MD, for clinical evaluation and Maria Sjöberg, nurse at the infection clinic, for assisting with patient data for the Section Parasitic infections. Cases are reviewed and diagnoses are adapted to the current WHO-classification by Helene Johansson, Reg. Biomedical Scientist, Sahlgrenska University Hospital, Göteborg.
Read the article Understanding histograms
Download white paper understanding histograms as pdf