You are already analyzing blood – change it up and go a step further with blood cell histograms.
If you regularly perform CBCs on patients, then you will be very familiar and comfortable analyzing blood values to check for abnormalities. But there is another capability of automated hematology analyzers that you might be overlooking: blood cell histograms. Because, with the information a blood cell histogram can reveal, you may get valuable additional insights that can aid in patient diagnosis.
Blood cell histograms analysis is probably easier than you think
First things first, what is a blood cell histogram and what can it show? Put simply, it plots the sizes of different blood cells (red and white blood cells and platelets) on an X-axis and their relative number on a Y-axis. This creates a distribution curve like below, showing how the different-sized blood cells are distributed:
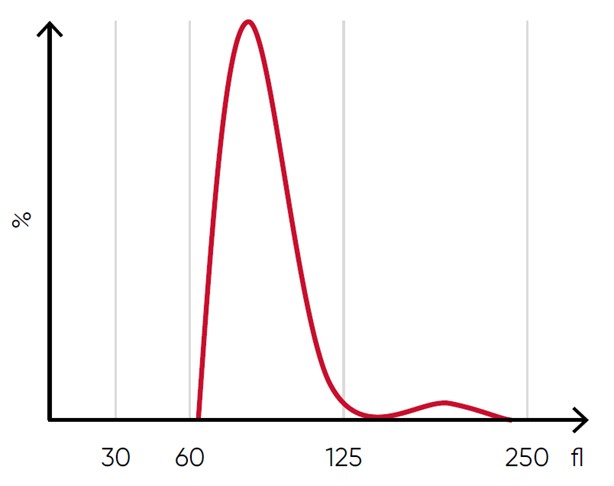
Histogram showing a normal distribution of red blood cells
Histogram analysis looks for deviations and irregularities from these normal curves – which, in many cases, can give you important information straightaway. And the next step in the process of disease investigation.
You don’t need to be a hematologist. Just a human.
Analyzing blood cell histograms is second nature in a hematology lab. And it can be for you too. It feels like math – and it is – but it is really all about pattern recognition, which we are naturally very good at as humans. Once you spot the abnormalities and see the pattern, you check it against a reference (at the start but, over time, you begin to recognize the pattern on your own) and you have important diagnostic information. With no wait – instead the ability to address next steps with the patient there and then.
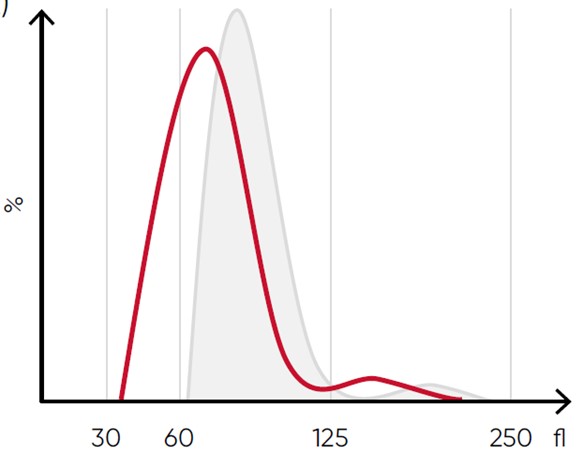
Side-by-side comparison showing deviation from first RBC histogram and indicating a specific condition
What’s more, the abnormalities you are looking for are very few and very basic. Simple visual cues like, “Is there a shift to the left or the right?”, “Is there an abnormal high at the upper or lower end?”, and “Is the peak higher or lower than normal?”. Just by looking at the histogram you’ll spot any of these and be able to match with a reference case. Like in the downloadable case book we have produced for our customers and users.
It’s not that complicated, with only a little practice needed to get you up to speed. So, try it. You might see benefits.
An easy win for you and your patients
Because, while it can be an important early diagnostic tool for patients, and more efficient for your operation, it is also about you and helping the patient diagnostics and blood analysis you perform every day. Understanding histograms gives an additional perspective that, in turn, gives you more confidence in making your own second opinion.
Interested in reading more? Here is a more detailed but still smooth dive into histogram analysis using a modern, automated analyzer.
And don’t hesitate to request for a hard copy of the case book for reference to get you started.
If you have any questions or need any more support in this or any other area, feel free to contact us. Change is good – but it is even better and easier together!
More News

Studies have shown complete blood count testing to be relevant for monitoring of severity and progression of Dengue fever

Discover the crucial role of gentle mixing in preventing pre-analytical errors in laboratory testing.