Swelab Lumi performance comparison

Performance comparison of Swelab Lumi hematology system with a reference system intended for use in large hospital laboratories

Hematology analyses are routinely performed both by large clinical hospital laboratories on fully automated, high-throughput analyzers as well as by smaller physician’s office laboratories on stand-alone analyzers. As clinical laboratory tests form the basis for patient diagnosis, analyzer accuracy and precision are equality important independent of sample scale or clinical setting.

Swelab Lumi – reliability when it counts

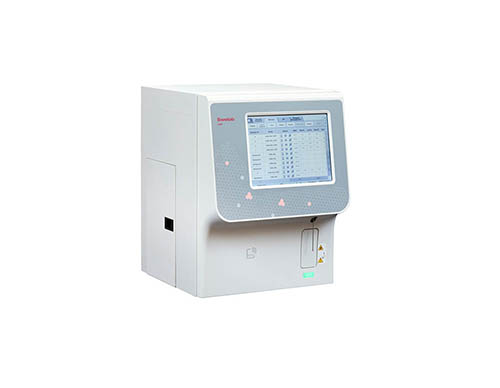
Swelab Lumi is a hematology system intended for the smaller laboratory (Fig 1). The analyzer provides information on 29 parameters for the CBC, including red blood cells (RBC) and platelets (PLT), hemoglobin (HGB), as well as a 5-part differential count of the WBCs.

Swelab Lumi employs well-proven measurement technologies. The analyzer uses impedance for RBC and PLT counts, while the WBC differential is conducted by laser-based flow cytometry. HGB is determined spectrophotometrically.

Swelab Lumi provides comparable performance to reference system

Dr. Ravindra Patwadkar and coworkers at the Dr. Hedgewar Hospital, Aurangabad, Maharashtra, India conducted a study to compare the performance of Swelab Lumi with a reference system intended for the larger hospital laboratory (Fig 2). 

“More than 200 live samples with various value ranges were evaluated simultaneously in the test instrument Swelab Lumi and reference instrument Beckman Coulter DxH 800 in the month of August 2018”, Dr Patwadkar explains. “The results show that Swelab Lumi is in good agreement with the reference system. The analyzers provide similar conditions for patient decisions. Swelab Lumi generated analytical data close to microscopic examination and is a good option for smaller clinical and hospital laboratories.”

image1 (2)

Fig 2. Agreement between cell count in the Swelab Lumi test and DxH 800 reference (Beckman Coulter) hematology analyzers. Passing-Bablok regression graphs are shown for (A) WBC, (B) RBC, (C) HGB, (D) MCV, (E) HCT, (F) RDW%, (G) PLT, and (H) MPV. In regression plots, the gray line is the line of identity (x = y) and the red line is the line of best fit.

Get contacted by Boule

Fill in the online contact form, and we will get back to you.