Ensure analytical quality and performance of your automated hematology system
An incentive for centralization of diagnostic testing is the possibility to improve testing efficiency, while lowering the cost per test. However, there are situations where near-patient testing can be of greater benefit to the patient. Not only is on-site testing convenient for the patient, omitting the need to travel a longer distance to a site for blood sampling and testing. On-site testing can also be crucial for reducing turnaround time in case quick response is required to meet urgent clinical needs.
Today’s technology advancements have enabled both miniaturization and improved cost-efficiency of hematology analyzers, allowing the use of systems capable of reporting high-quality results from a complete blood count (CBC) also in smaller laboratories. Provided that measurement quality can be guaranteed, an automated hematology system can be a useful tool in early disease investigation and monitoring of disease progress.
Introduction
Clinical diagnostics is a cornerstone in healthcare and the results form the basis for medical decision-making. Hematology analysis is widely requested, both as an initial test in patient assessments as well as in monitoring of disease progression and treatment efficacy. Although the first automated hematology analyzers were launched already in the 1950s, the method is still widely adopted in diagnostic laboratories worldwide. A hematology analysis is cheaper relative to many more specific tests, and therefore accessible, and the results provide insights for many disease conditions that affect the blood cells, such as certain infections, anemia, blood clotting problems, and blood cancers.
The growing demand for hematology testing can, to large part, be attributed to the aging population, requiring a greater number of tests, and the increasing investments in healthcare in emerging markets (1). Traditionally, hematology testing is conducted at a clinical laboratory away from the patient. However, today’s technology advancements have enabled equipment manufacturers to provide small devises that produce laboratory-quality analysis results that can be automatically transferred to the laboratory information system (LIS). Such equipment facilitates health assessments in the primary care, shortening time to diagnosis and initiation of treatment.
Decentralized testing devices have thus significantly contributed to the overall growth of the hematology market, which is expected to reach 821 MUSD by 2024 (1). In laboratory hematology, CBC tests account for about 40% of total revenues, compared with hemoglobin at 20% and other tests (e.g., hemostasis and coagulation) combined at the remaining 40%. Improved cost-efficiency of benchtop analyzers is among the factors that have been driving this development, which is seen further accelerated by the COVID-19 pandemic (2).
Another practice that has gained increased popularity during the COVID-19 pandemic is telemedicine, with the opportunity to provide patients access to medical experts at a lower cost (3). However, telemedicine does not allow diagnostic testing. Patients monitored for disease recovery or adjustment of medication dosage for chronic diseases would greatly benefit from having access to nearby testing services to prevent prolonging the time to a new diagnosis.
Sigward Söderström, former Biomedical Scientist at Örebro University Hospital explains the benefit with Boule hematology solutions in decentralized laboratory testing:
“ The great benefit of using Boule analyzers for blood cell counting in primary care is that the lead times from blood tests to diagnosis are significantly shortened. Being able to make a correct diagnosis as soon as possible and start the right treatment significantly increases the patient’s ability to recover from their illness. The possibility of being able to catch the patient already in primary care also contributes to significantly greater patient safety and quality of care.”
Requirements on short turnaround testing devices
In addition to a having a compact design to fit in confined spaces, a device suitable for decentralized testing should provide rapid results at a favorable price to provide any benefit over sending samples away for analysis, for example, to a reference testing facility or a larger hospital laboratory. As decentralized healthcare providers, such as a doctor’s office or primary care unit, can lack laboratory-trained staff, it is preferred that the device is of sufficiently low complexity to allow handling by non-laboratory trained personnel, for example, a nurse. As a vein puncture requires a specially trained phlebotomist, it is many times preferred that the testing device supports analysis of whole blood collected from a simple fingerstick capillary sample. Reagent formulation should allow storage at room temperature for a certain period of time, as refrigerator storage may not be available in the doctor’s office. Function and performance of the device should be robust and reliable, as service and support can be located at a far distance.
It is also requested that decentralized testing devices shall provide sufficient insight to support clinical decisions. An automated hematology system provides results from a complete blood count in less than a minute. A small device for on-site patient testing thus supports frequent monitoring of patients suffering from diseases that affects the blood cells (e.g., dengue fever or malaria), assessment of patients undergoing oncology treatments (e.g., chemotherapy), and for screening of blood donors (e.g., for adverse effects such as anemia, thrombocytopenia, and lymphocytopenia).
As the site for testing is not necessarily the site for interpretation of the results, connectivity that facilitates sharing data with off-site expertise supports the patient-centric approach that decentralized testing constitutes.
Pre-analytical risk factors
Improper procedures for blood collection, transportation, and storage might alter the analysis results so that they do not correctly reflect the patient’s health condition. Data shows that most of all laboratory errors (approx. 70%) can be traced back to the pre-analytical phase (5). Hemolysis is one of the most common reasons why a whole blood sample is rejected for testing and can be caused, for example, by poor phlebotomy technique when collecting venous blood, milking the finger when collecting capillary blood, too narrow needle, or improper transportation or storage conditions (6). In addition, cold temperatures can cause blood clotting. For example, platelets may become activated when stored at refrigerated temperatures, with spontaneous aggregation as result. Other pre-analytical errors that can result in the need to call back the patient for resampling is blood collection in the wrong tube or insufficient filling of the tube.
Delayed sample analysis is also a common factor associated with the risk of the sample being unsuitable for analysis, especially if the blood sample is sent for testing at a centralized laboratory. Definition of transportation and storage conditions that ensure the stability of whole blood samples collected for CBC testing is therefore necessary to ensure accurate measurement results.
Pre-analytic risk factors related to storage and transportation can be minimized when time between sampling and analysis is shortened, for example, as when testing is performed on site.
Key process steps in focus for analyzer performance enhancements
In the first-generation hematology analyzers, a fixed volume of sample was aspirated using a peristaltic pump. The aspiration process was time-dependent, that is, the pump was calibrated to aspirate sample during a fixed time into a mixing cup, where the sample was diluted. The diluted sample was thereafter allowed to pass through an aperture under a pressure gradient at a fixed time, during which the sample flow (volume/time unit) and number of pulses (corresponding to the cell number) were recorded. The software analyzed the size of each pulse and ascribed the corresponding cell to a discriminator-defined cell population.
Over the years, the major technology advancements of automated hematology analyzers can be related to three steps of the cell count process:
– Sample aspiration technique.
– Cell count method (sample dilution and cell count principle).
– Cell discrimination method.
Sample aspiration technique
Although simple and economic to build, the first-generation analyzers had their technical limitations. The precision and accuracy were poor, making the reliable use of these systems
in monitoring the efficacy of medicine difficult. Time-based aspiration by using a peristaltic pump suffers from frequent system calibration, as the aspirated volume starts deviating
from the “ideal volume” with the decreasing efficiency of the pump, resulting in high variation (CV) in the results.
Such an aspiration method also requires that the aspiration module moves to the mixing cup through an X-Y moving assembly, which might increase the frequency of maintenance.
The open mixing cup that is required for the free-moving aspiration assembly is also susceptible to accumulation of dust and other impurities. In later years, most manufacturers
have replaced the peristaltic pump with a micro-syringe that reduces the frequency of calibration to some extent, however, frequency of maintenance remains the same.
Cell count method
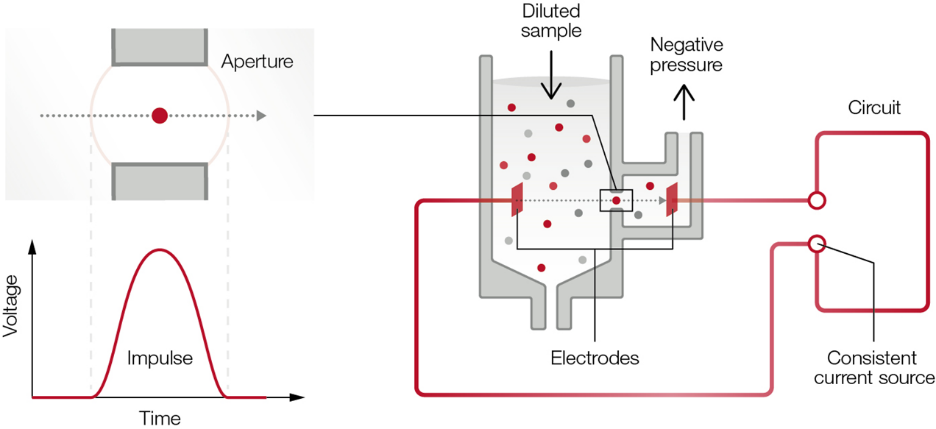
The basic principle of the time-based aspiration method is that the aspirated blood sample is diluted and thereafter flushed to the measuring chamber. A pressure difference between the two sides of the aperture is built up, after which the number of pulses caused by cells flowing through the aperture is counted as a function of time (Fig 1).
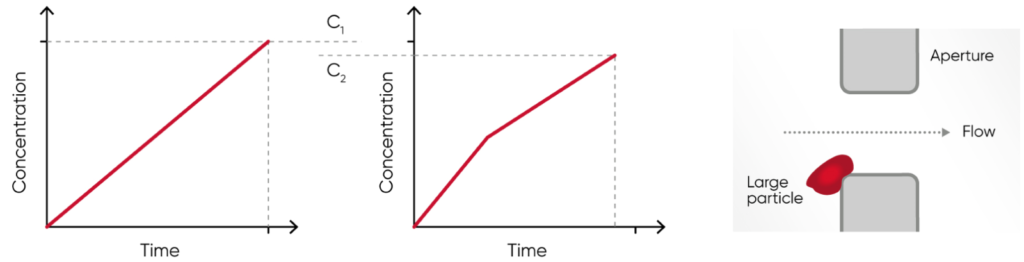
After a certain time, the process is interrupted and the cell concentration (c) in the diluted sample is calculated (Fig 2). As the measurement is a function of time, the method suffers from high probability of inaccuracy if there is a small change in the pressure difference over the aperture or if protein or any other impurities build up within the aperture and partially block (thereby reduce) the flow, and as consequence, decreases the recorded concentration (c).
Some manufacturers claim that their analyzers count the cells twice or even three times to increase accuracy. However, if the aperture is clogged, the accuracy and precision will not
necessarily improve by counting the cells more times. Instead, the re-calibration need might increase.
The second-generation analyzers, pioneered by Sysmex, offered unique solutions to both the aspiration technique, using a sample rotary valve (shear valve), and cell count method, calculating the cell concentration based on a fixed volume of diluted sample and the number of generated pulses in that specific volume. This method is known as the “absolute volume measurement principle”.
In these second-generation analyzers, the aspirated volume is greater than in the first-generation analyzers, using a time-based method for the cell count. Rather than time dependency, the aspiration is stopped by a blood sensor and a precise volume is cut and brought to a closed mixing chamber using diluent reagent. This way, no mechanical
movement of the aspiration module is required, minimizing the maintenance needs. As the shear valve cuts the same precise volume for each measurement, the analyzer calibration stays
stable for a longer period of time.
Fig 1. The principle for measuring changes in the electrical impedance produced by a cell passing through an aperture. Each cell passing through the aperture gives rise to a pulse. The number of generated pulses correlates with the number of cells, whereas the size of the pulse is related to the cell size.
Fig 2. Compared with (A) the cell concentration 1 (c1), the (B) cell concentration 2 (c2) can be falsely low in case of (C) build-up of particles that clog the aperture, resulting in inaccurate measurement results.
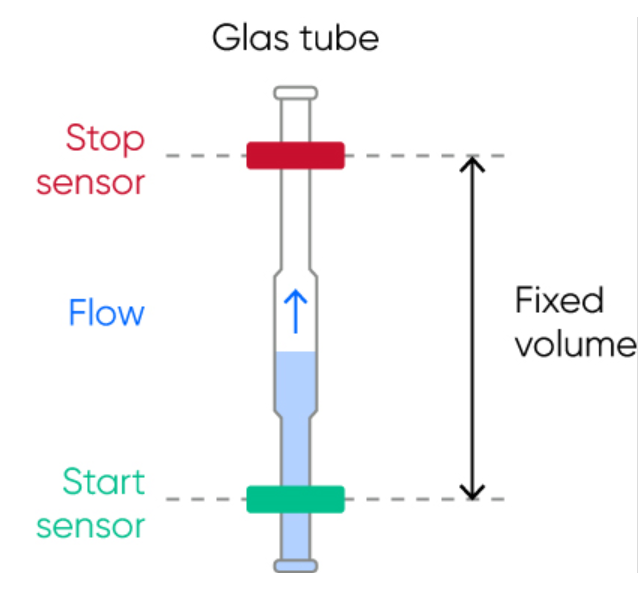
For the cell count, the diluted sample pushes the liquid (diluent) in a metering unit, consisting of a glass tube and two optical sensors. When the diluent flows through the tube, it first triggers the start-sensor and then the stop-sensor and the cell count is registered during these two trigger events. The volume between the start- and stop-sensors is equal to the measured volume of the diluted sample used for the cell count (Fig 3).
The interval of reaching from the start-sensor to the stop-sensor might vary (within a stipulated time range) due to a partial clog of the aperture, however, the cell count will continue until the diluent reaches the stop-sensor and a constant volume is thus always recorded, ensuring precise and accurate results.
As the test results from a second-generation analyzer are independent of external pressure or temperature or even partial clog at the aperture or dust particles in the mixing chamber, the variation in measured parameters is also significantly lower than for first-generation analyzers. The risk of dust particles affecting the results is especially critical for the smallest corpuscles, namely the platelets.
Although the complex nature of the hardware increased the instrument cost, these second-generation analyzers were a better choice for medical decision-making than the first-generation instruments.
Fig 3. The metering unit, consisting of a glass tube and two optical sensors, ensures precise and accurate cell count results each time.
Overcoming the limitation of second-generation analyzers
Still, there were areas where the second-generation instruments failed:
Microcytic RBCs counted as PLTs:
Accurate and precise PLT count is extremely important for diagnosis and monitoring of patients suffering from diseases like dengue fever, Leptospirosis, and malaria infection. The PLT count is also an important tool to determine whether a patient is ready to be administered a chemotherapy dose. A falsely elevated PLT count is therefore a challenge for individuals with high numbers of microcytic RBC populations.
NEU falsely counted as LYM:
Strong hemolytic effect of the lyse reagent used in first- and second-generation analyzers resulted in false lymphocytosis, for example, during early sepsis conditions where the NEU cells lose their cellular structure and thus counted as LYM cells.
High maintenance needs:
For instruments using an open sheer valve, salt crystals and blood remnants that get in contact with air can deposit at the junction of the two discs of the shear valve, requiring excessive manual cleaning. If not done in a timely manner, the crystals enhance the wear and tear of this expensive part.
Although partial clogging does not impact the accuracy of results in second-generation instrument, it is good for the operator to know the cleanliness of the aperture during operations. Consequently, the second-generation analyzers were set with a mandatory auto de-clogging process on a regular basis, which enhanced the wear and tear of the costly aperture.
By the introduction of the Medonic™ and Swelab™ analyzers, as part of the third-generation cell counters, Boule Diagnostics provided solutions to all these challenges:
Floating discriminator technique ensures accurate separation of the RBC and PLT populations (see Section Cell discrimination method).
The mild lyse reagent helps create a WBC size gradient, while maintaining cell structure even of pathogenic NEUs to prevent them from being over-hemolyzed, thereby minimizing the risk of them interfering with the LYM count.
Closed shear valve design prevents entry of environmental impurities that might cause contamination and leakage. Additionally, the shear valve is flushed with diluent reagent to prevent build-up of salt deposits that might also cause leakage. To avoid wear and tear of the shearing discs, the shear valve is soaked in diluent, ultimately mitigating the need for replacement.
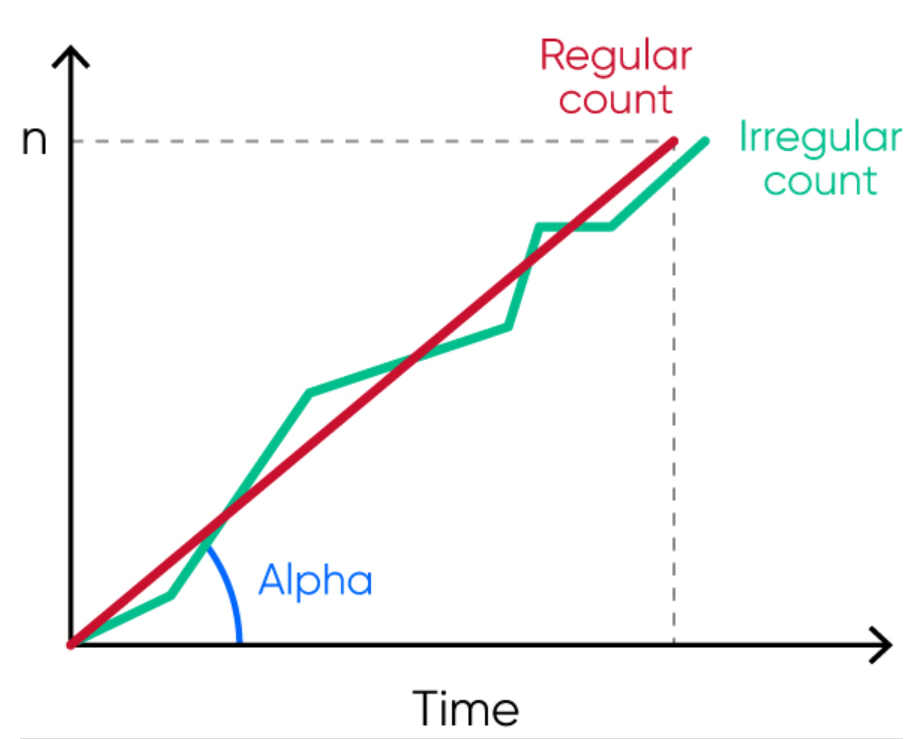
To reduce risk for clogging, high-voltage burning of the aperture (cleaning based on generated air bubbles) is automatically carried out, but only when needed to reduce wear and tear. The flow rate is monitored by the analyzer and if the flow is irregular, an error alarm is triggered to alert the operator to re-count the cells and a de-clogging is automatically performed by the analyzer (Fig 4).
Fig 4. The analyzer regularly monitors the flow rate, and irregular flow triggers an SE (measurement statistics warning) flag that alerts the operator of that automatic de-clogging will be conducted by the analyzer.
Cell discrimination method
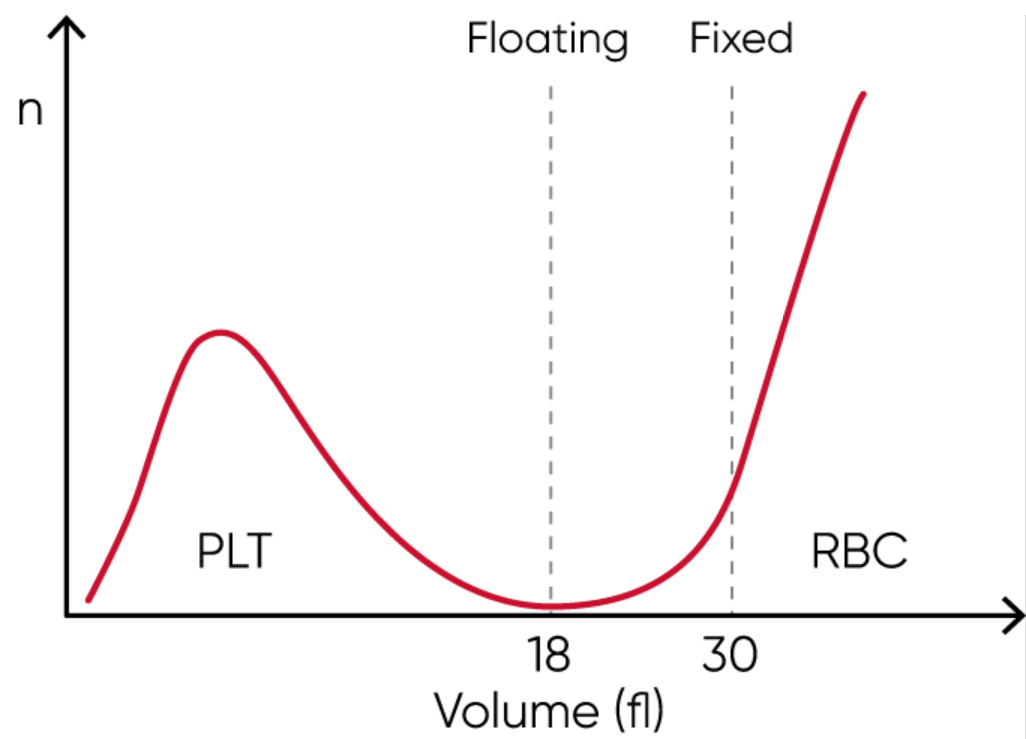
Many legacy cell counters use a fixed discriminator at 30 fL for separation of RBC and PLT populations. However, excessive number of PLTs might interfere with the mean red cell volume (MCV) parameter. Similarly, microcytic (small) RBCs with low MCV can give falsely elevated PLT counts, as the minima between PLT and RBC histograms cannot be identified due to the mix of microcytic RBCs and PLTs well before the cell size discriminator at 30 fL.
Such effects can be minimized with floating discriminator technique that estimates the best separation between cell populations. Medonic and Swelab 3-part analyzers use a discriminator that floats between 10 and 28 fL, thereby preventing the microcytic RBCs to be falsely counted as PLTs (Fig 5).
Fig 5. Floating discriminator technique prevents microcytic RBCs to be falsely counted as PLTs and elevated PLTs to interfere with the RBC count.
Boule Total Quality Concept
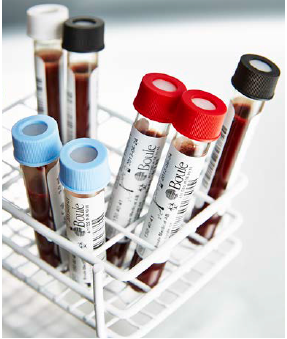
An automated hematology system comprises both the analyzer as well as its dedicated consumables (Fig 6). At Boule Diagnostics, reagents are designed and developed in conjunction with the analyzer to provide optimized performance and enhanced serviceability of the complete system. Reagents and analyzer measurement technology, including the analysis algorithms, are fine tuned to each other to produce the most accurate patient results. Formulations, dilutions, mixing, and reaction kinetics are all carefully matched and optimized to work together.
One of the most important elements of a complete hematology system is the quality control (QC) material. Like the reagents, the control and calibrator cell populations are matched to the system measurement technologies and analysis algorithms.
Fig 6. It is recommended to use of Boule controls every day as a routine QC procedure. Barcode screening facilitates input of assay values, while preventing potential errors.
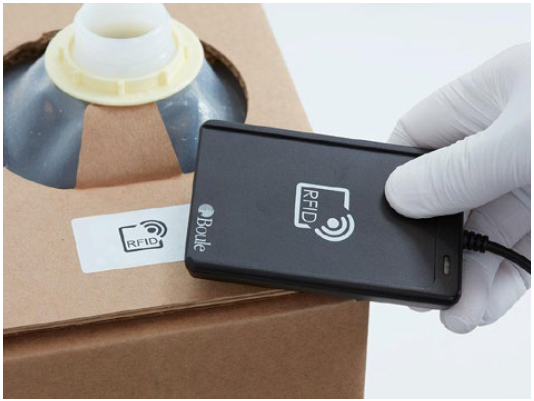
To ensure analytical quality and performance, it is therefore recommended to only use consumables that are specifically designed for the intended analyzer. To facilitate proper use of Boule hematology systems, reagents are entered by simply scanning the RFID card (or barcode) on the reagent container (Fig 7). At the same time, the analyzer stores key reagent information such as lot number, open and expiry dates, and remaining volume, all for operator convenience.
Fig 7. To ensure analytical quality and performance of the hematology system, it is recommended to only use the designated reagents that are entered by scanning the RFID card (or barcode) on the container.
Conclusion
Results from a low-cost hematology analysis can be used in evaluation of the need for more expensive tests or for sending samples away for further testing at a central laboratory. Near-patient hematology testing is also often used when close monitoring of patient recovery is required, for example, in progression of an infectious disease affecting the blood cells, prior to chemotherapy, or in assessment of regular blood donors.
Provided that measurement quality can be guaranteed, an automated hematology system can be a useful tool in early patient assessments and in monitoring of disease progression and treatment efficacy.
References
1. Report: Hematology and Coagulation Markets, Kalorama, May 2020
2. Agarwal et al. How SARS-CoV-2 Will Catalyze Decentralized Testing. www.healthadvancesblog.com Apr 2020 (accessed 27 Feb 2021).
3. Whelan, C. 17 benefits of telemedicine for doctors and patients. www.healthline.com Nov 9, 2020 (accessed 27 Dec 2020).
4. Whitepaper: Complete blood count and its utility in fever investigations. Boule Diagnostics, 39211, Edition 1 (2021).
5. Daves et al. Sample stability for complete blood cell count using the Sysmex™ XN haematological analyser. Blood Transfus 13, 576–582 (2015)
6. Kurec, A. Identifying and managing hemolysis interference with CBC specimens. www.mlo-online.com Dec 22, 2016 (accessed 21 Jul 2021)
information about cookies BOULE DIAGNOSTICS AB (PUBL)
General
Boule Diagnostics AB (publ) (“Boule”) uses cookies and similar technologies (jointly called “cookies”) which are text files placed on your computer, to collect standard Internet log information and visitor behavior information in an anonymous form. Usually, cookies carry identification on the source, a timestamp for expiry, and a scrambled settings value.
Cookies work like your browser’s memory – they enable your device to remember settings in between sessions, such as items stored in the cart, language settings and currency preferences. In short: they ensure you do not have to select the same preferences over again every time you visit a website.
Our use of cookies may include processing of your personal data and we therefore recommend that you read our Privacy Policy, which can be found here privacy policy.
There is plenty to read about cookies and how they work online. A good place to start is http://www.allaboutcookies.org/.
What types of cookies do boule use?
We use a cookie to administrate our cookie banner as well as other essential cookies which are necessary for the website to function properly (“essential cookies”). With your consent, we also use third-party cookies for analytical and advertisement purposes (“non-essential cookies”). Boule only uses non-essential cookies when you have given your prior consent.
Some cookies (session cookies) last throughout the session, meaning they expire when you leave the website. Persistent cookies are stored in your browser’s cookie folder until they are deleted. They enable us to recognize you when you return and remember your settings on our websites. Necessary cookies: Necessary cookies are essential for the website to function properly. These cookies ensure basic functionalities and security features of the website, anonymously. Functional cookies: Functional cookies help to perform certain functionalities like sharing the content of the website on social media platforms, collect feedbacks, and other third-party features. Analytical cookies: Analytical cookies are used to understand how visitors interact with the website. These cookies help provide information on metrics, the number of visitors, bounce rate, traffic source, etc. Advertisement cookies: Advertisement cookies are used to provide visitors with relevant ads and marketing campaigns. These cookies track visitors across websites and collect information to provide customized ads. Other cookies: Other uncategorized cookies are those that are being analyzed and have not been classified into a category yet.
We use cookies i.e. for user authentication, to control the level of access to information on our websites, to pre-fill forms, and gather web traffic statistics.
Read how Boule treats Cookies
Privacy Overview
This website uses cookies to improve your experience while you navigate through the website. Out of these cookies, the cookies that are categorized as necessary are stored on your browser as they are essential for the working of basic functionalities of the website. We also use third-party cookies that help us analyze and understand how you use this website. These cookies will be stored in your browser only with your consent. You also have the option to opt-out of these cookies. But opting out of some of these cookies may have an effect on your browsing experience.
Necessary cookies are absolutely essential for the website to function properly. These cookies ensure basic functionalities and security features of the website, anonymously.
Cookie
Duration
Description
cookielawinfo-checkbox-advertisement
1 year
Set by the GDPR Cookie Consent plugin, this cookie is used to record the user consent for the cookies in the "Advertisement" category .
cookielawinfo-checkbox-analytics
11 months
This cookie is set by GDPR Cookie Consent plugin. The cookie is used to store the user consent for the cookies in the category "Analytics".
cookielawinfo-checkbox-functional
11 months
The cookie is set by GDPR cookie consent to record the user consent for the cookies in the category "Functional".
cookielawinfo-checkbox-necessary
11 months
This cookie is set by GDPR Cookie Consent plugin. The cookies is used to store the user consent for the cookies in the category "Necessary".
cookielawinfo-checkbox-others
11 months
This cookie is set by GDPR Cookie Consent plugin. The cookie is used to store the user consent for the cookies in the category "Other.
cookielawinfo-checkbox-performance
11 months
This cookie is set by GDPR Cookie Consent plugin. The cookie is used to store the user consent for the cookies in the category "Performance".
CookieLawInfoConsent
1 year
Records the default button state of the corresponding category & the status of CCPA. It works only in coordination with the primary cookie.
viewed_cookie_policy
11 months
The cookie is set by the GDPR Cookie Consent plugin and is used to store whether or not user has consented to the use of cookies. It does not store any personal data.
Functional cookies help to perform certain functionalities like sharing the content of the website on social media platforms, collect feedbacks, and other third-party features.
Cookie
Duration
Description
_zcsr_tmp
session
Zoho sets this cookie for the login function on the website.
Performance cookies are used to understand and analyze the key performance indexes of the website which helps in delivering a better user experience for the visitors.
Analytical cookies are used to understand how visitors interact with the website. These cookies help provide information on metrics the number of visitors, bounce rate, traffic source, etc.
Cookie
Duration
Description
_ga
2 years
The _ga cookie, installed by Google Analytics, calculates visitor, session and campaign data and also keeps track of site usage for the site's analytics report. The cookie stores information anonymously and assigns a randomly generated number to recognize unique visitors.
_ga_ZXZ83CBBQK
2 years
This cookie is installed by Google Analytics.
_gat_gtag_UA_107130558_8
1 minute
Set by Google to distinguish users.
_gat_gtag_UA_107130558_9
1 minute
Set by Google to distinguish users.
_gat_UA-107130558-7
1 minute
A variation of the _gat cookie set by Google Analytics and Google Tag Manager to allow website owners to track visitor behaviour and measure site performance. The pattern element in the name contains the unique identity number of the account or website it relates to.
_gid
1 day
Installed by Google Analytics, _gid cookie stores information on how visitors use a website, while also creating an analytics report of the website's performance. Some of the data that are collected include the number of visitors, their source, and the pages they visit anonymously.
CONSENT
2 years
YouTube sets this cookie via embedded youtube-videos and registers anonymous statistical data.
Advertisement cookies are used to provide visitors with relevant ads and marketing campaigns. These cookies track visitors across websites and collect information to provide customized ads.
Cookie
Duration
Description
VISITOR_INFO1_LIVE
5 months 27 days
A cookie set by YouTube to measure bandwidth that determines whether the user gets the new or old player interface.
YSC
session
YSC cookie is set by Youtube and is used to track the views of embedded videos on Youtube pages.
yt-remote-connected-devices
never
YouTube sets this cookie to store the video preferences of the user using embedded YouTube video.
yt-remote-device-id
never
YouTube sets this cookie to store the video preferences of the user using embedded YouTube video.
yt.innertube::nextId
never
This cookie, set by YouTube, registers a unique ID to store data on what videos from YouTube the user has seen.
yt.innertube::requests
never
This cookie, set by YouTube, registers a unique ID to store data on what videos from YouTube the user has seen.
Other uncategorized cookies are those that are being analyzed and have not been classified into a category as yet.
Cookie
Duration
Description
__wpdm_client
session
No description
34f6831605
session
No description
crmcsr
session
No description available.
e188bc05fe
session
No description available.
global_ref
7 days
No description
iamcsr
session
No description available.
I accept the settings above. Change these settings at any time via Your cookies on the right side of the website. Save the above selectionsAccept all
Manage consent
Privacy Overview
This website uses cookies to improve your experience while you navigate through the website. Out of these cookies, the cookies that are categorized as necessary are stored on your browser as they are essential for the working of basic functionalities of the website. We also use third-party cookies that help us analyze and understand how you use this website. These cookies will be stored in your browser only with your consent. You also have the option to opt-out of these cookies. But opting out of some of these cookies may have an effect on your browsing experience.
Necessary cookies are absolutely essential for the website to function properly. These cookies ensure basic functionalities and security features of the website, anonymously.
Cookie
Duration
Description
cookielawinfo-checkbox-advertisement
1 year
Set by the GDPR Cookie Consent plugin, this cookie is used to record the user consent for the cookies in the "Advertisement" category .
cookielawinfo-checkbox-analytics
11 months
This cookie is set by GDPR Cookie Consent plugin. The cookie is used to store the user consent for the cookies in the category "Analytics".
cookielawinfo-checkbox-functional
11 months
The cookie is set by GDPR cookie consent to record the user consent for the cookies in the category "Functional".
cookielawinfo-checkbox-necessary
11 months
This cookie is set by GDPR Cookie Consent plugin. The cookies is used to store the user consent for the cookies in the category "Necessary".
cookielawinfo-checkbox-others
11 months
This cookie is set by GDPR Cookie Consent plugin. The cookie is used to store the user consent for the cookies in the category "Other.
cookielawinfo-checkbox-performance
11 months
This cookie is set by GDPR Cookie Consent plugin. The cookie is used to store the user consent for the cookies in the category "Performance".
CookieLawInfoConsent
1 year
Records the default button state of the corresponding category & the status of CCPA. It works only in coordination with the primary cookie.
viewed_cookie_policy
11 months
The cookie is set by the GDPR Cookie Consent plugin and is used to store whether or not user has consented to the use of cookies. It does not store any personal data.
Functional cookies help to perform certain functionalities like sharing the content of the website on social media platforms, collect feedbacks, and other third-party features.
Cookie
Duration
Description
_zcsr_tmp
session
Zoho sets this cookie for the login function on the website.
Performance cookies are used to understand and analyze the key performance indexes of the website which helps in delivering a better user experience for the visitors.
Analytical cookies are used to understand how visitors interact with the website. These cookies help provide information on metrics the number of visitors, bounce rate, traffic source, etc.
Cookie
Duration
Description
_ga
2 years
The _ga cookie, installed by Google Analytics, calculates visitor, session and campaign data and also keeps track of site usage for the site's analytics report. The cookie stores information anonymously and assigns a randomly generated number to recognize unique visitors.
_ga_ZXZ83CBBQK
2 years
This cookie is installed by Google Analytics.
_gat_gtag_UA_107130558_8
1 minute
Set by Google to distinguish users.
_gat_gtag_UA_107130558_9
1 minute
Set by Google to distinguish users.
_gat_UA-107130558-7
1 minute
A variation of the _gat cookie set by Google Analytics and Google Tag Manager to allow website owners to track visitor behaviour and measure site performance. The pattern element in the name contains the unique identity number of the account or website it relates to.
_gid
1 day
Installed by Google Analytics, _gid cookie stores information on how visitors use a website, while also creating an analytics report of the website's performance. Some of the data that are collected include the number of visitors, their source, and the pages they visit anonymously.
CONSENT
2 years
YouTube sets this cookie via embedded youtube-videos and registers anonymous statistical data.
Advertisement cookies are used to provide visitors with relevant ads and marketing campaigns. These cookies track visitors across websites and collect information to provide customized ads.
Cookie
Duration
Description
VISITOR_INFO1_LIVE
5 months 27 days
A cookie set by YouTube to measure bandwidth that determines whether the user gets the new or old player interface.
YSC
session
YSC cookie is set by Youtube and is used to track the views of embedded videos on Youtube pages.
yt-remote-connected-devices
never
YouTube sets this cookie to store the video preferences of the user using embedded YouTube video.
yt-remote-device-id
never
YouTube sets this cookie to store the video preferences of the user using embedded YouTube video.
yt.innertube::nextId
never
This cookie, set by YouTube, registers a unique ID to store data on what videos from YouTube the user has seen.
yt.innertube::requests
never
This cookie, set by YouTube, registers a unique ID to store data on what videos from YouTube the user has seen.